The Big Mac index: what a burger says about your currency (and the pizza index too)
What the Big Mac index says about your currency in 2026, why a burger can't settle exchange rates, how it tracks inflation, and the pizza index and other alternatives.


A Big Mac costs 7.30 Swiss francs in Zurich and $6.22 in the United States. At the July 2026 exchange rate, the Swiss one works out at $9.04. By the logic of a burger, that makes the Swiss franc 45% overvalued against the dollar.
That is the Big Mac index, and the figures come from the latest edition, which The Economist publishes as open data. It started as a joke, and economists at central banks and universities have since written whole papers about it. The Economist still updates it twice a year, in January and July.
So what does a hamburger actually tell you about a currency? Quite a lot, as it turns out, as long as you know what it leaves out. Below is how the index works, what the 2026 numbers say, why a burger can't settle exchange rates on its own, how well it predicts them anyway, and what the pizza index and the other quirky indices measure instead.
What the Big Mac index measures
The index rests on an old idea called purchasing power parity, or PPP. If the same thing sells in two countries, a dollar should buy the same amount of it in both once you convert the currency. If it doesn't, one of the currencies is "too strong" or "too weak" compared with what its prices say.
Economists normally test this with a big basket of goods. A Big Mac is a basket you can eat. It's made to roughly the same recipe almost everywhere, so its price is a quick way to compare what money buys in each country.
Two economists at the St. Louis Fed describe it as an annual "tongue-in-cheek comparison" that The Economist has published since 1986.
Fun fact: The Big Mac is older than the index by almost two decades. Jim Delligatti, a McDonald's franchise owner in Pennsylvania, created it in 1967, and it went national across the United States the following year, according to the same St. Louis Fed paper.
How to read the number, with the euro
Here is the arithmetic for the euro area. A Big Mac cost €6.19 there in July 2026 and $6.22 in the United States. Divide one by the other and you get the exchange rate that would make the two burgers cost the same: about 0.995 euros per dollar.
The actual rate in the dataset was 0.874 euros per dollar. A dollar bought fewer euros than burger parity says it should, so the euro was the "strong" side. The gap, 0.995 divided by 0.874, puts the euro 13.8% overvalued against the dollar.
Think of it like comparing the price tag on the same shirt in two shops. If one shop charges more, either its prices are high or the money you pay with is worth more than it looks.
What the July 2026 edition says
Europe looks expensive. Of the 54 countries in the July 2026 data, Switzerland had the priciest Big Mac at $9.04, and Norway, Britain, Sweden, the euro area and Denmark all came out overvalued against the dollar.
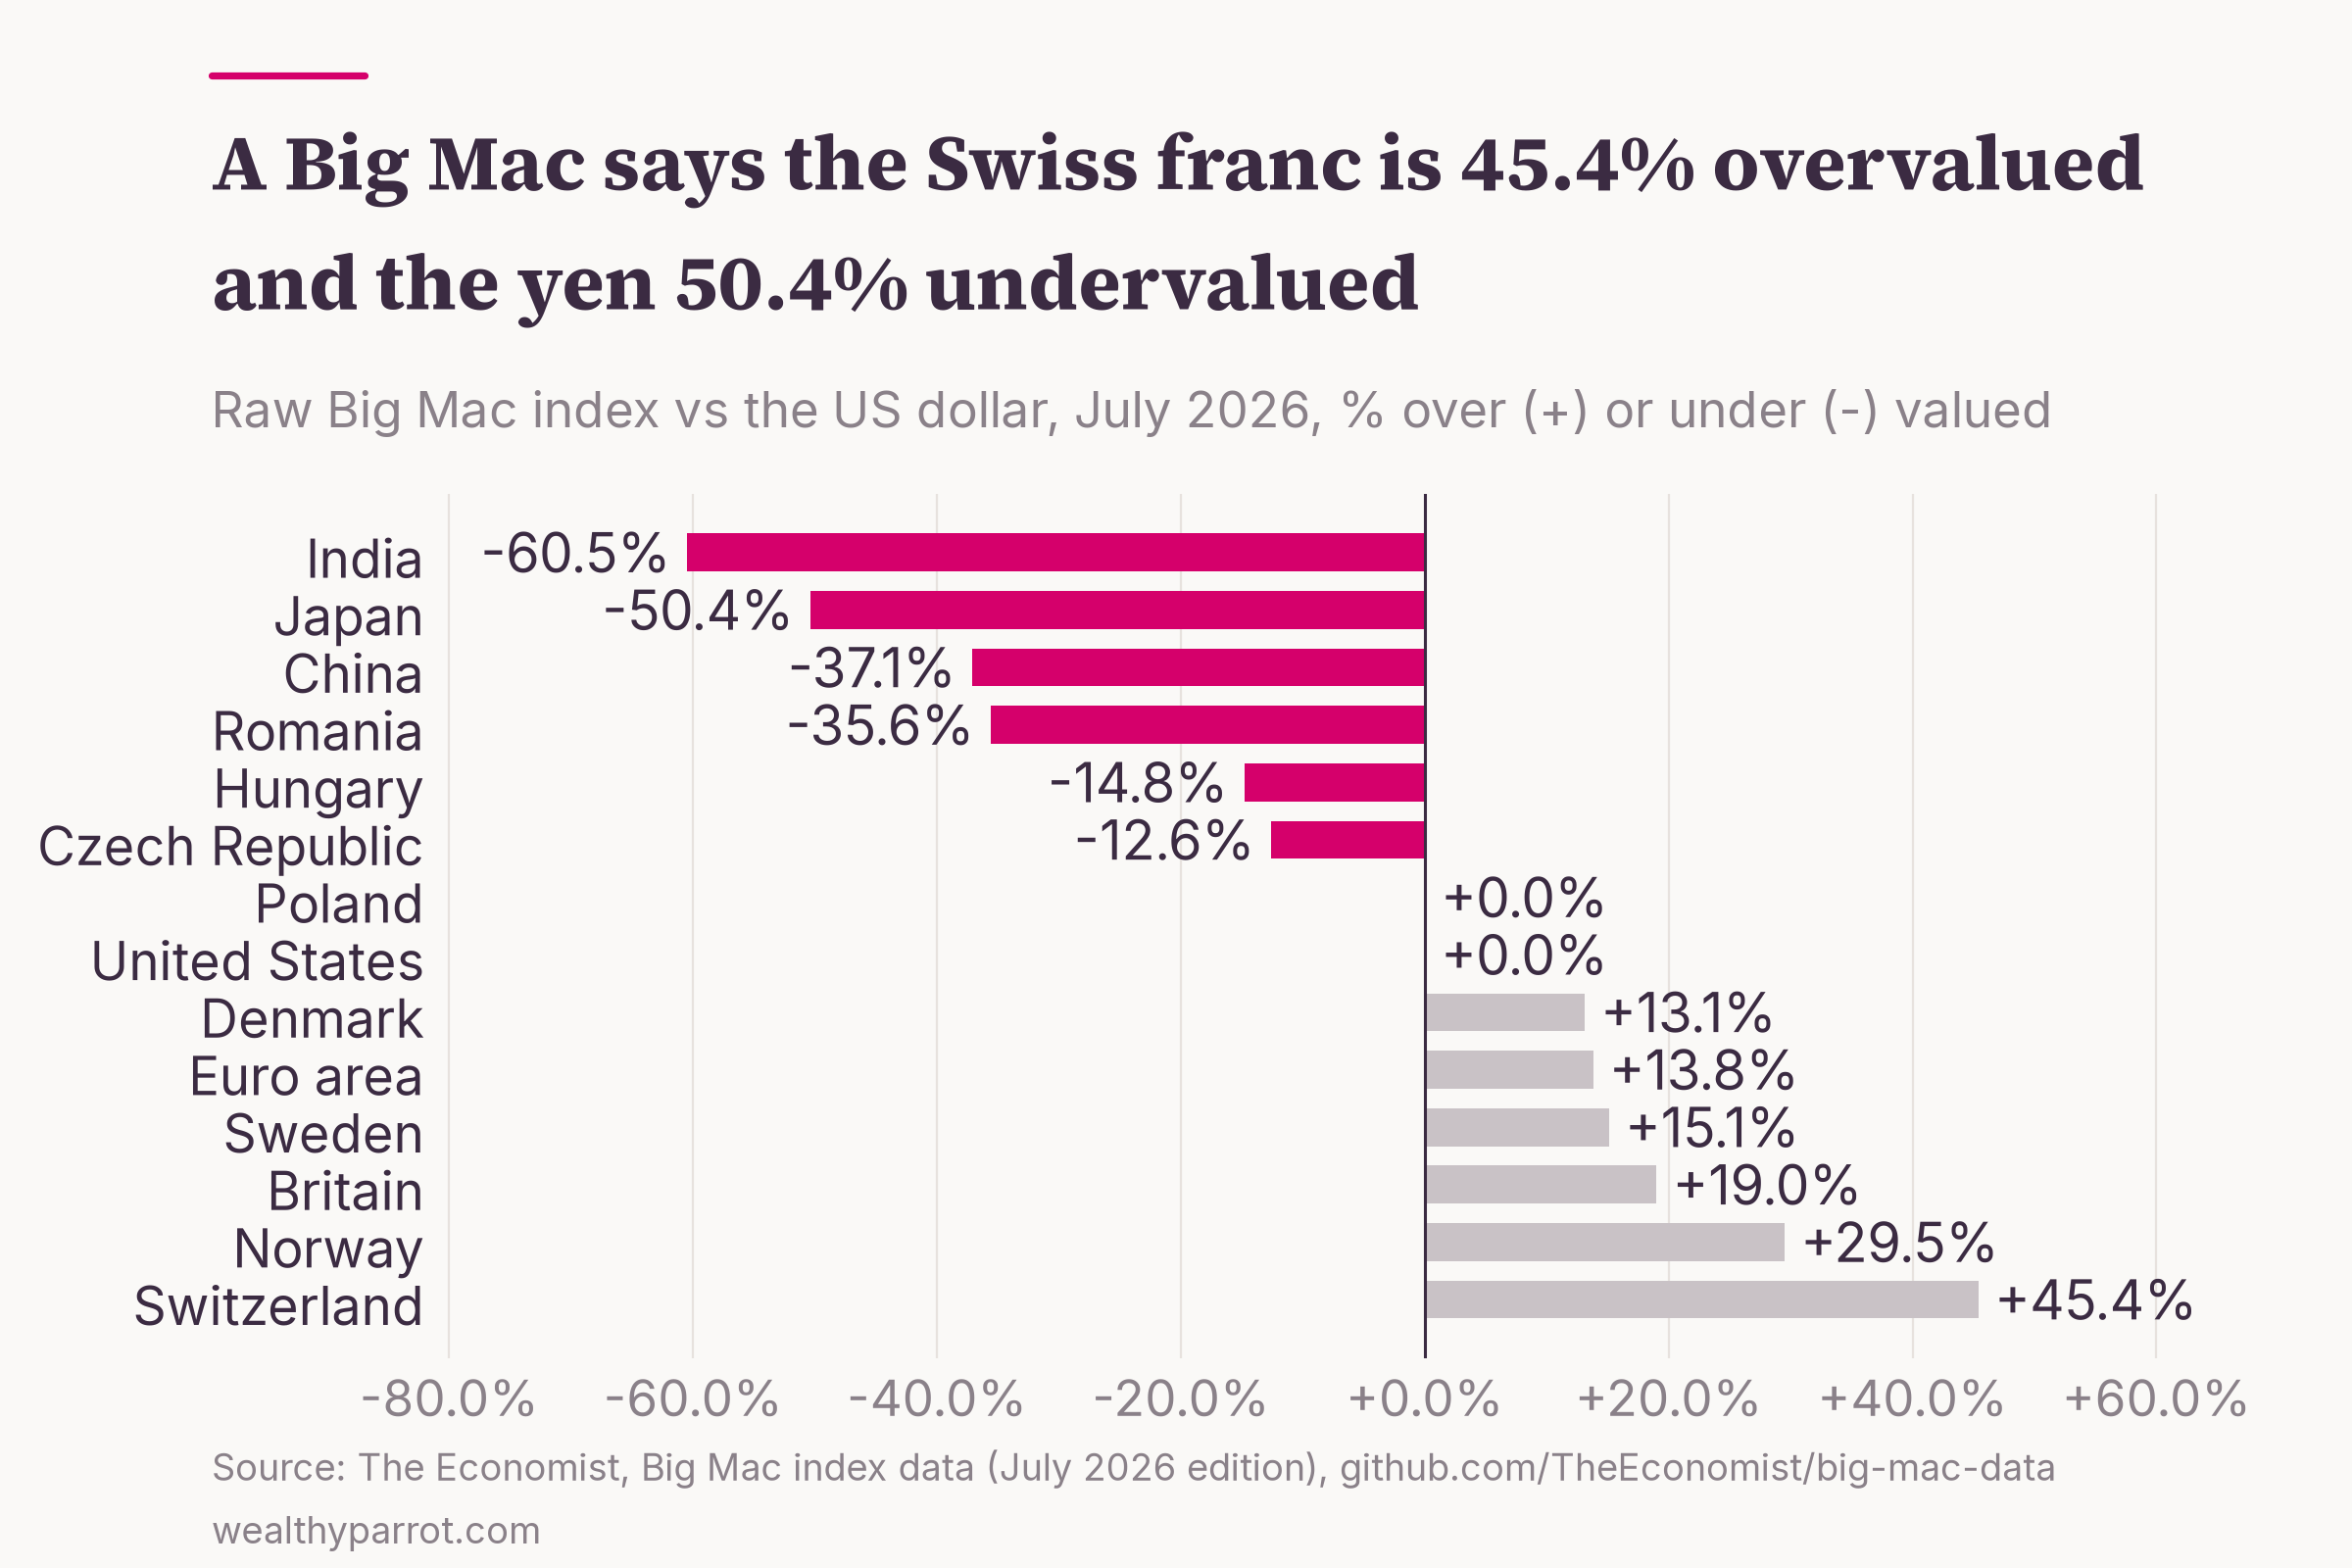
Poland landed almost exactly on parity: 23.50 złoty for a Big Mac works out at $6.22 at the July rate. The Czech Republic and Hungary were about 13-15% cheap, and Romania 36% cheap.
The cheapest burgers were in Asia. A Big Mac cost 500 yen in Japan, about $3.08, which puts the yen 50% undervalued. India came in at $2.45 and Indonesia at $2.38, the cheapest in the whole survey (yes, cheaper than a Big Mac in India).
What does that mean if you earn euros? Fly to New York and a Big Mac costs $6.22, which at 0.874 is about €5.44, cheaper than the €6.19 you pay at home. By the burger's logic, your euros stretch further in the US than the exchange rate alone suggests, and much further in Tokyo.
Why a burger can't settle exchange rates
If the index worked perfectly, traders would ship Big Macs from Tokyo to Zurich and pocket the difference. Nobody does, for reasons that tell you a lot about prices in general. The St. Louis Fed paper names three causes. Trade across borders costs money, some parts of a Big Mac can't be traded at all, and companies charge what each market will bear.
Trade barriers and taxes
Start with the beef. Japan replaced its beef import quota with a tariff in 1991 and cut that tariff from 70% to 38.5% by 2000, according to the Fed economists. A tariff like that makes a burger dearer at home and makes the currency look stronger than it is.
Taxes do the same. The prices in the index include sales tax or VAT, so a country with a high tax on a Big Mac looks overvalued even if nothing else differs. When Canada introduced a 7% goods and services tax in 1991, its Big Mac went from C$2.19 to C$2.35, and the Canadian dollar suddenly looked less undervalued (no, the tax didn't make the currency any stronger).
Rent and wages, the 94% problem
The bigger issue is that a Big Mac is mostly not beef and bread. To sell one, McDonald's has to rent a restaurant, heat it, light it and pay people to cook and serve. Economists call those non-traded costs, because you can't import a cheaper Beijing shopfront to serve lunch in San Francisco.
One estimate, cited in the Fed paper, puts non-traded costs such as wages and rent at 94% of a Big Mac's price. Picture the burger as a bundle of local rent and local wages, with a little beef inside for flavour.
That also explains why I find the McDonald's business model so interesting. The company earns a big share of its money as a landlord to its own franchisees, and rent is exactly the cost that varies most from city to city.
Fun fact: In India, where McDonald's doesn't sell beef, the Big Mac's place was taken by the Maharaja Mac, made with chicken patties and on sale since 1996. In 2003 that was enough to keep India out of the survey altogether, according to the St. Louis Fed paper.
The GDP-adjusted index
Rich countries pay their workers more, and since most of a Big Mac's price is wages and rent, rich countries have dearer burgers. Economists call this the Balassa-Samuelson effect, after the two economists who formalised it in 1964. In plain terms, poor countries will always look cheap on the raw index, whatever their currency is doing.
The Economist publishes a second version to correct for this. The adjusted index asks how much a Big Mac should cost given each country's GDP per person, and compares the real price with that. Its data notes say it changed the method in July 2022 and now adjusts GDP per person by the difference in Big Mac prices.
The adjustment changes the picture. Poland goes from parity on the raw index to 19.3% overvalued, because a country with Poland's income would be expected to have a cheaper burger. China moves from 37.1% undervalued to 23.8%, and the euro area from 13.8% to 29.1% overvalued.
Does the index predict anything?
A joke index would be useless if currencies ignored it. The research says they don't, at least over a year or more.
An economist writing for the National Bureau of Economic Research tested the first decade of data in 1996. Once he allowed for each currency's usual gap from parity, deviations from Big Mac parity had a half-life of about one year, meaning half of any gap tended to close within a year. Studies of broad price levels put that at four to five years. A 10% undervaluation in one year went with a 3.5% appreciation the next.
A later test covered more than two decades. Three economists who revisited the index two decades on found that the raw index carries a substantial bias.
Once that bias is allowed for, it tracks exchange rates reasonably well over the medium to long term. They also compared it with a random walk, the standard benchmark that simply assumes tomorrow's exchange rate will equal today's. The index did at least as well at predicting currencies over all but short horizons.
That is a respectable record for a burger, but it's a long way from a trading signal. The yen shows why. It was 27% undervalued on the index in January 2015, and instead of closing, the gap widened to 50% by 2026 (yes, anyone who bet on the yen catching up is still waiting). Currencies can stay far from parity for a long time, and over a few months the index tells you very little.
The Big Mac as an inflation gauge
There's a second way to use the data, and it's the one many people search for. Instead of comparing countries, follow one country's Big Mac price over time and see how it compares with official inflation.
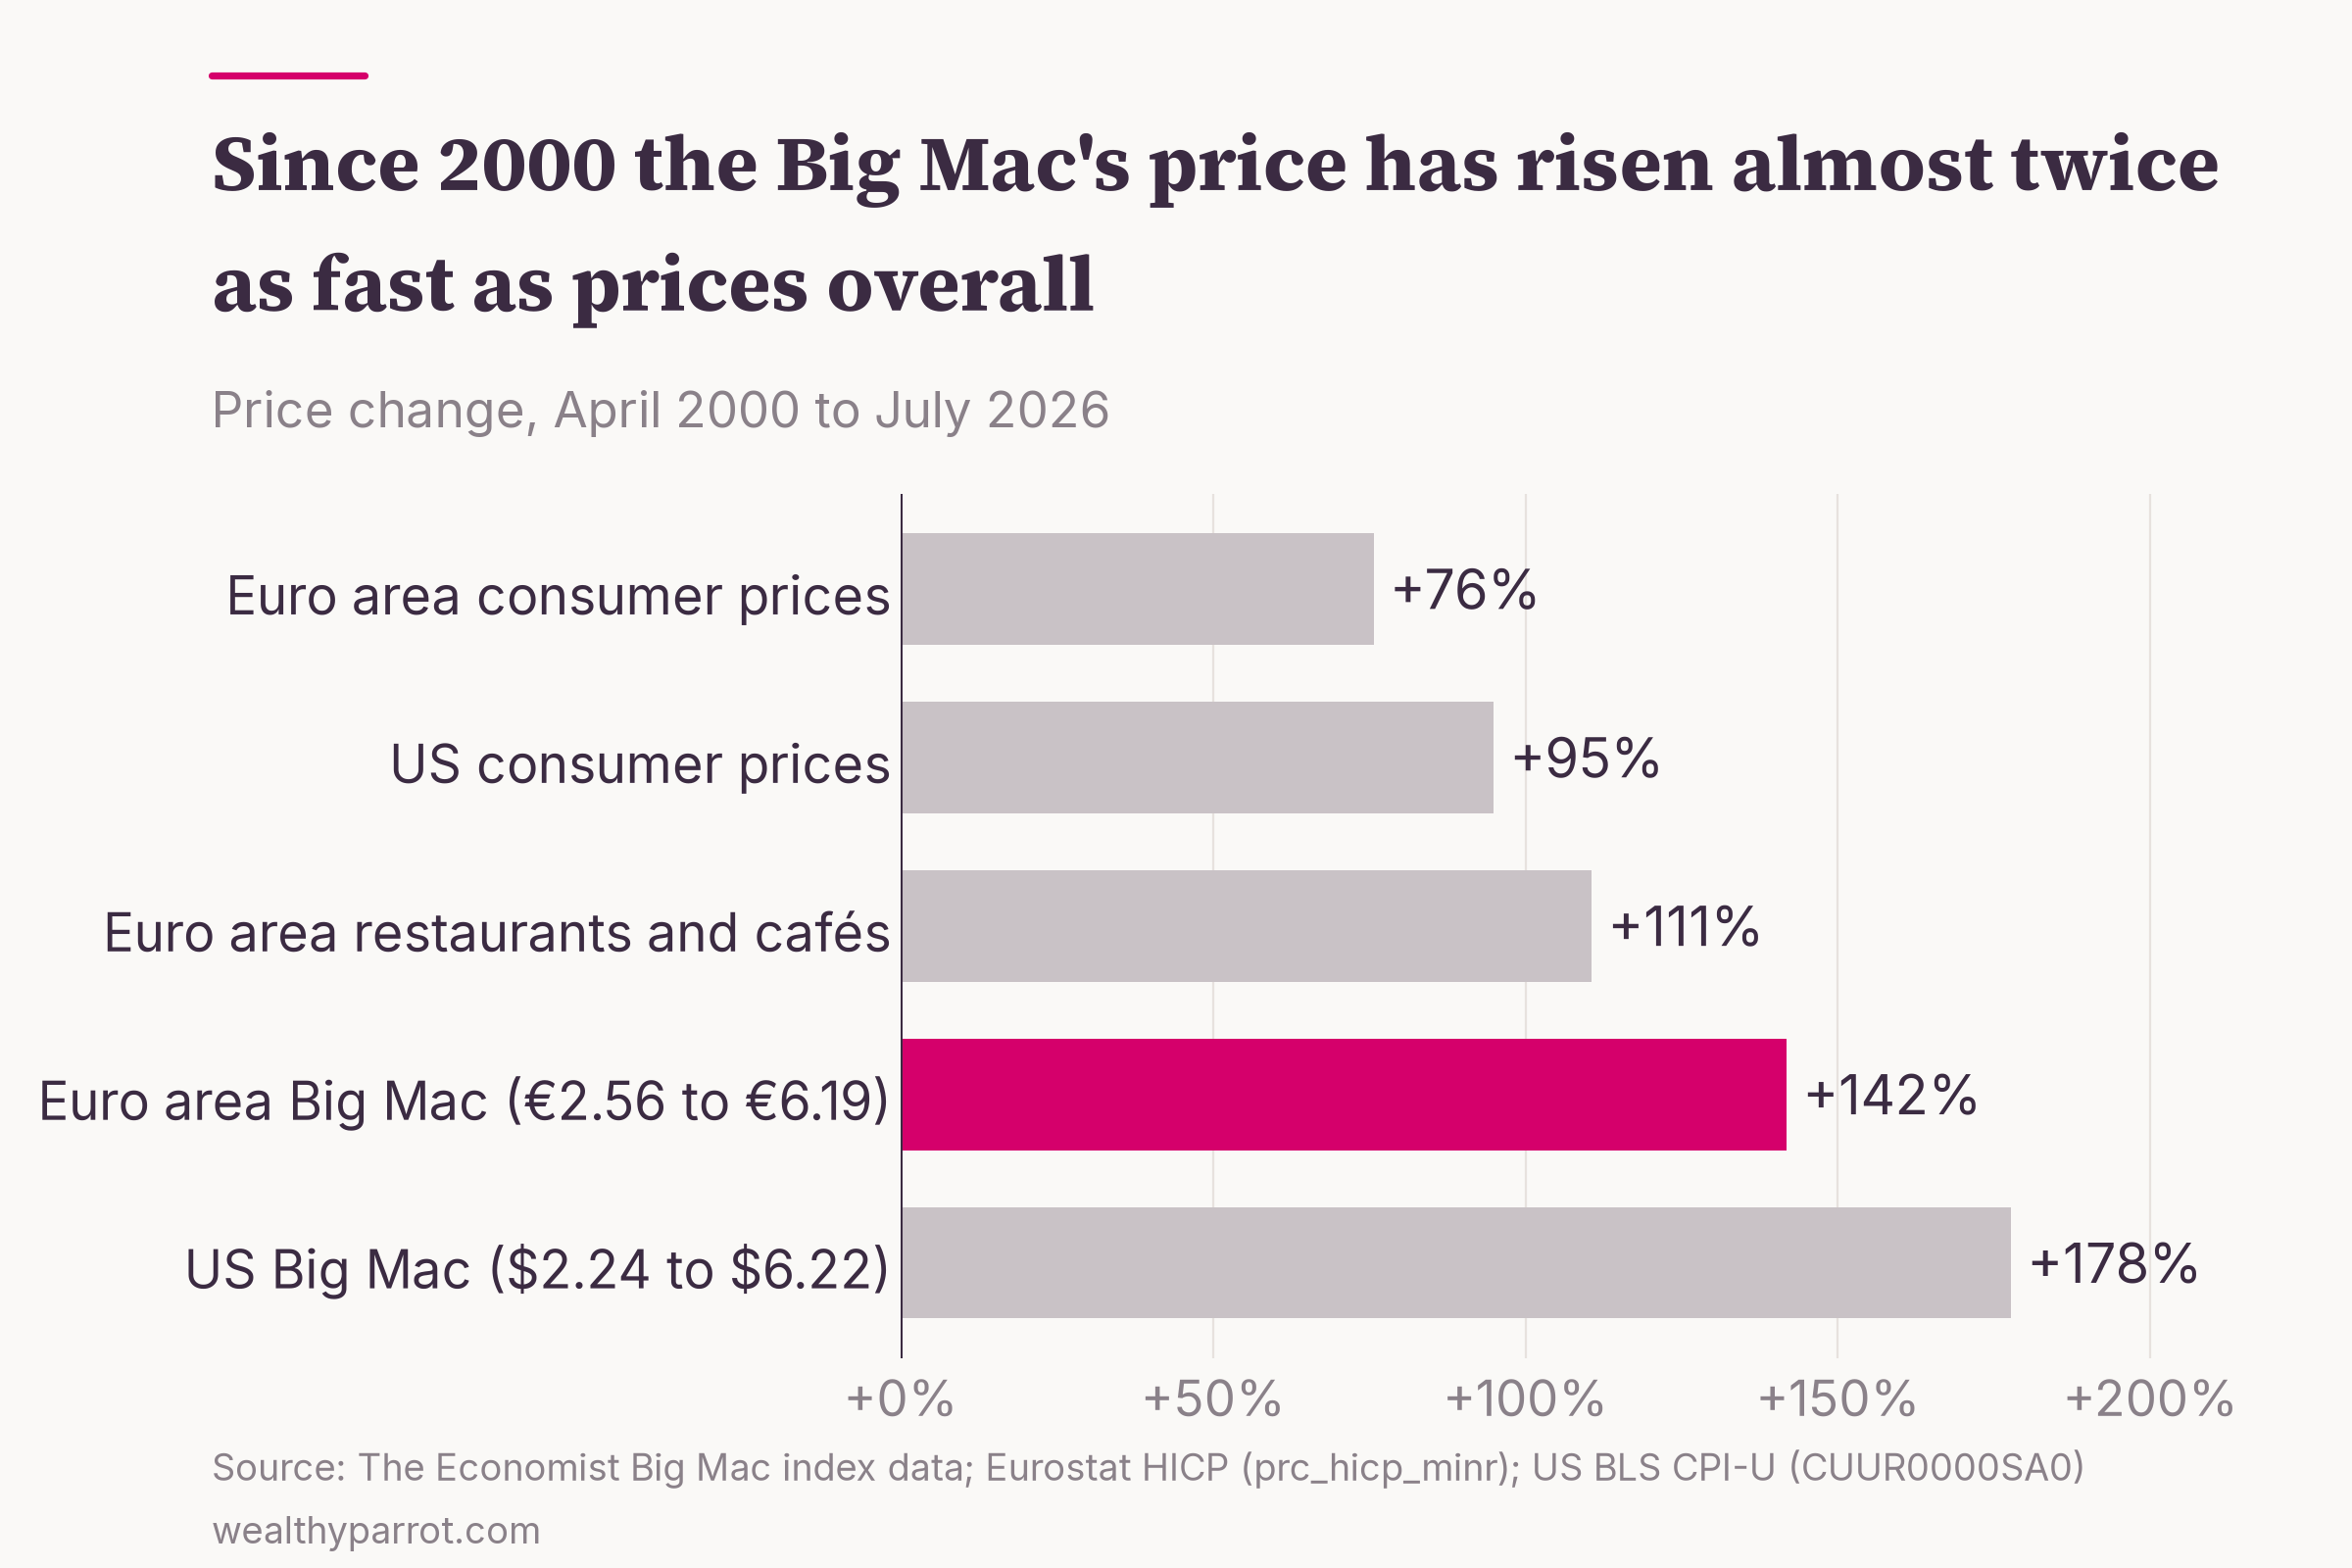
The burger has outrun prices in general by a wide margin. In the United States a Big Mac cost $2.24 in April 2000 and $6.22 in July 2026, up 178%, while consumer prices rose 95% according to the Bureau of Labor Statistics. In the euro area it went from €2.56 to €6.19, up 142%, against 76% for the harmonised consumer price index.
Does that mean official inflation figures understate your cost of living? Not on this evidence. A restaurant meal is mostly labour and rent, and those costs have risen faster than the price of goods. Eurostat's own index for restaurants and cafés in the euro area rose 111% over the same period, much closer to the Big Mac than to overall prices.
Two caveats from the data notes keep this honest. The US price comes from McDonald's itself since July 2022, after years of averaging four big cities. And the euro area price is an average across member countries, a group that has grown since 2000. If you want to understand what an inflation index does measure, I've explained how inflation, deflation and stagflation work in a separate piece.
Fun fact: The Swiss Big Mac has barely moved. It cost 5.90 francs in April 2000 and 7.30 francs in July 2026, up 24% in 26 years, while the euro area's rose 142%.
Big Mac index vs pizza index, and other alternatives
The Big Mac isn't the only everyday price people have turned into an economic indicator. Some of the alternatives measure something quite different, and a couple of the famous ones no longer exist in their old form.
The Pizza Principle
New Yorkers have their own version. The Pizza Principle says the price of a slice of pizza tracks the subway fare. According to lexicographer Barry Popik's collection of early citations, it first appeared in the New York Times in June 1980, where a patent attorney called Eric Bram claimed the two had matched "with uncanny precision."
The difference from the Big Mac index is what it compares. The pizza index follows one city over time, so it's really an inflation gauge. The Big Mac index compares many countries at once, so it's a currency gauge. For the record, the base subway fare is now $3, after a 10-cent rise on 4 January 2026.
The Billy bookcase index
Europe has a flat-pack rival. In 2009 a Bloomberg reporter compared the price of IKEA's Billy bookcase in 38 countries, ABC News reported. It was cheapest in Dubai at about $47.64 and dearest in Israel at $103.48, against an average of $60.09.
Like the Big Mac, the Billy is the same product almost everywhere. Unlike the Big Mac, it can be shipped, so its price says more about IKEA's pricing and local taxes than about wages and rent.
Fun fact: In 2003 the busiest McDonald's in the world was on Pushkin Square in Moscow. It seated 700 people, had 27 tills and served 40,000 customers a day, according to the St. Louis Fed paper.
The misery index
This one has nothing to do with burgers. The misery index adds a country's unemployment rate to its inflation rate. The Brookings Institution credits its former scholar Arthur Okun with inventing it in the 1970s, when America had plenty of both.
It's a rough gauge of how hard times feel to ordinary households (you probably don't need an index to tell you when both are high). It says nothing about wages or labour costs, so it's no use to a company deciding where to build a factory.
The lipstick effect
The idea that sales of small luxuries rise in a downturn is often called the lipstick index. It sounds like a myth, but it has some experimental support. In a 2012 study across several experiments, cues about a recession reduced women's desire for most products, such as electronics, but increased their desire for products that make them more attractive.
That makes it a theory about spending psychology, not a measure of prices or currencies. It's fun, and you'd need a lot more than lipstick sales to call a recession.
Happiness and business-climate rankings
Some indices rank countries on things money can't directly buy. The World Happiness Report is published by the Wellbeing Research Centre at the University of Oxford, with Gallup and the UN Sustainable Development Solutions Network, and Finland has topped it since 2018. I've written about what the research says on money and happiness separately.
The World Bank's Ease of Doing Business ranking is gone. The bank discontinued the report in September 2021, after data irregularities in its 2018 and 2020 editions were reported internally. It now publishes a different report, B-READY, which assesses the rules and public services that firms deal with.
The serious version of the Big Mac index
If you want the grown-up measure of purchasing power, it exists. The World Bank's International Comparison Program prices a full basket of goods and services and covered 176 economies for the reference year 2021, with results released in May 2024.
Those are the numbers behind "GDP at purchasing power parity", the version that lets you compare living standards across countries. I explain why that matters in my guide to GDP. The Big Mac index is the same idea squeezed into one sandwich, which is why it's easier to remember and harder to rely on.
What the Big Mac index means for your money
The index is most useful as a gut check on what local life costs. A cheap Big Mac usually means cheap local labour and rent, so services, meals out and haircuts will feel cheap to a visitor too. A dear one, as in Zurich or Oslo, warns you about everything with a waiter attached.
It matters if you move or work abroad as well. A salary offer in another country only makes sense next to what things cost there, and a Big Mac is a crude but quick first comparison before you look at rent.
For investors, the lesson is about currencies, not burgers. A world ETF is 72.94% American companies, as I found when I looked at how concentrated a world ETF really is. If you earn euros, the value of those holdings moves with the euro-dollar rate as well as with share prices. The Big Mac index says the euro looks strong on this measure, and the research says that kind of gap tends to close slowly, over years, in ways nobody can time.
Practical takeaways
- Read the Big Mac index as a currency gauge. A positive number means a currency buys less burger than the exchange rate implies, and a negative number means it buys more.
- Check the GDP-adjusted version before concluding a currency is cheap. Poorer countries always look cheap on the raw index because wages and rent are lower.
- Don't trade on it. The research finds the index useful over a year or more, and close to useless over a few months.
- Use it as a travel and relocation shortcut. A dear Big Mac usually means dear services, meals out and rent.
- When a quirky index makes a big claim, look for the serious measure behind it. For prices across countries that's the World Bank's purchasing power data, and for prices over time it's the official consumer price index.