How you actually withdraw the money


Two people retire on the same morning. Same age, same 600,000 in the pot, same low-cost world tracker, same plan to spend a little over 4% a year. Thirty years later, one of them dies with more money than they started with. The other ran out at 82 and spent their last decade terrified of the letterbox.
Over those thirty years, both portfolios earned the exact same average return.
The difference came down to the order the good and bad years arrived in - not skill, not fees, not fund selection. One retiree met a run of strong years first, up 22%, then 14%, then 8%, and only hit a crash in year 25, when it barely mattered. The other walked straight into a three-year bear market, down 18%, 12% and 8%, while selling shares every month to buy groceries. Same average, opposite lives.
The question nobody answers
Type "how much do I need to retire" into any search bar and you will drown in answers. The 4% rule. The 25x number. A hundred calculators, mine included, that turn your savings rate into a finish line.
That is the easy half. It is arithmetic you do once, years in advance, in a spreadsheet where nothing can go wrong.
The hard half starts the day the salary stops. Which account do you actually sell from first? What do you do when the market is down 20% and rent is due? Do you buy an annuity or manage the money yourself? These are the questions that decide whether the pot lasts, and they are the ones almost no one walks you through. (I have written before about how strangely hard it is to actually spend the money once you have saved it; this piece is about the mechanics of taking it out, not the fantasy of how much you piled up.)
Why the order of returns can beat the average
While you are saving, a crash is a gift. Your salary keeps buying shares, and it buys them cheap. A bad decade early in your working life is one of the best things that can happen to a long-term investor.
The moment you stop earning and start spending, that logic flips. Now every month you sell a slice of the portfolio to live on. If prices are low, you sell more shares to raise the same 2,000. Those shares are gone. They are not there to recover when the market comes back. A big drop in the first few years of retirement does permanent damage that an identical drop later does not. This is sequence-of-returns risk, and it is the single most under-appreciated force in retirement.
Researchers have measured it directly. Clare, Seaton, Smith and Thomas defined and quantified the effect in the Financial Analysts Journal in 2017, showing how much of the failure risk in a drawdown portfolio comes purely from timing. A 2024 study by Tamimi and co-authors in the Financial Planning Research Journal isolated it more cleanly still, re-running the 4% rule with declines that arrive at random times rather than smoothly, so the only thing changing between simulations is when the bad years land. And DeJong and Robinson, in a 2021 Journal of Wealth Management retrospective, traced real retirees through the 2000-2002 and 2007-2009 bear markets - not a simulation, actual cohorts - and found the ones who retired straight into those years were still carrying the scar two decades later.
Fun fact: the worst year in modern history to start a US retirement was not 1929. According to William Bengen, the researcher who built the original safe-withdrawal work, a retiree who stopped work in 1968 had a harder ride than one who retired weeks before the Great Crash, because 1968 was followed by a grinding decade of high inflation that ate withdrawals from both ends.
What it looks like in euros
Numbers make this concrete, so I borrowed some. The Italian finance Professor Paolo Coletti built an open Monte Carlo simulation of nine different withdrawal strategies and published the code. I downloaded it and re-ran it myself: 10,000 randomised 50-year paths, a starting pot of 600,000, drawing 26,000 a year (2,000 a month plus a thirteenth-month top-up - as in Italy most people get paid over 13 months and not 12) adjusted every year for euro-area inflation. That is a 4.3% starting withdrawal over half a century - a deliberately demanding, early-retirement stress test, not a gentle 30-year case.
Two honest caveats before the results. This is one model with one set of assumptions and my own random draw, so my figures differ from Coletti's video. And the model is transparent about its own history: readers spotted bugs in the original code and fixed them in the open, which is a point in its favour, not against it.
Here is what the reproduction showed. A pure-equity portfolio lasted longest in the typical case - a median of about 38 years before exhaustion - but it had the fattest tail of early disasters: in the unluckiest 5% of paths the money was gone by year 16, and just under 1% of retirees ran dry before year 12. Blend in a ladder of bonds covering the first ten years of spending, and the typical run shortened a little, to around 35 years, but the unlucky-5% case improved sharply, pushing exhaustion out to year 19 and cutting the "gone before year 12" outcomes to essentially zero. A strategic 60/40 did the same job from the other direction.
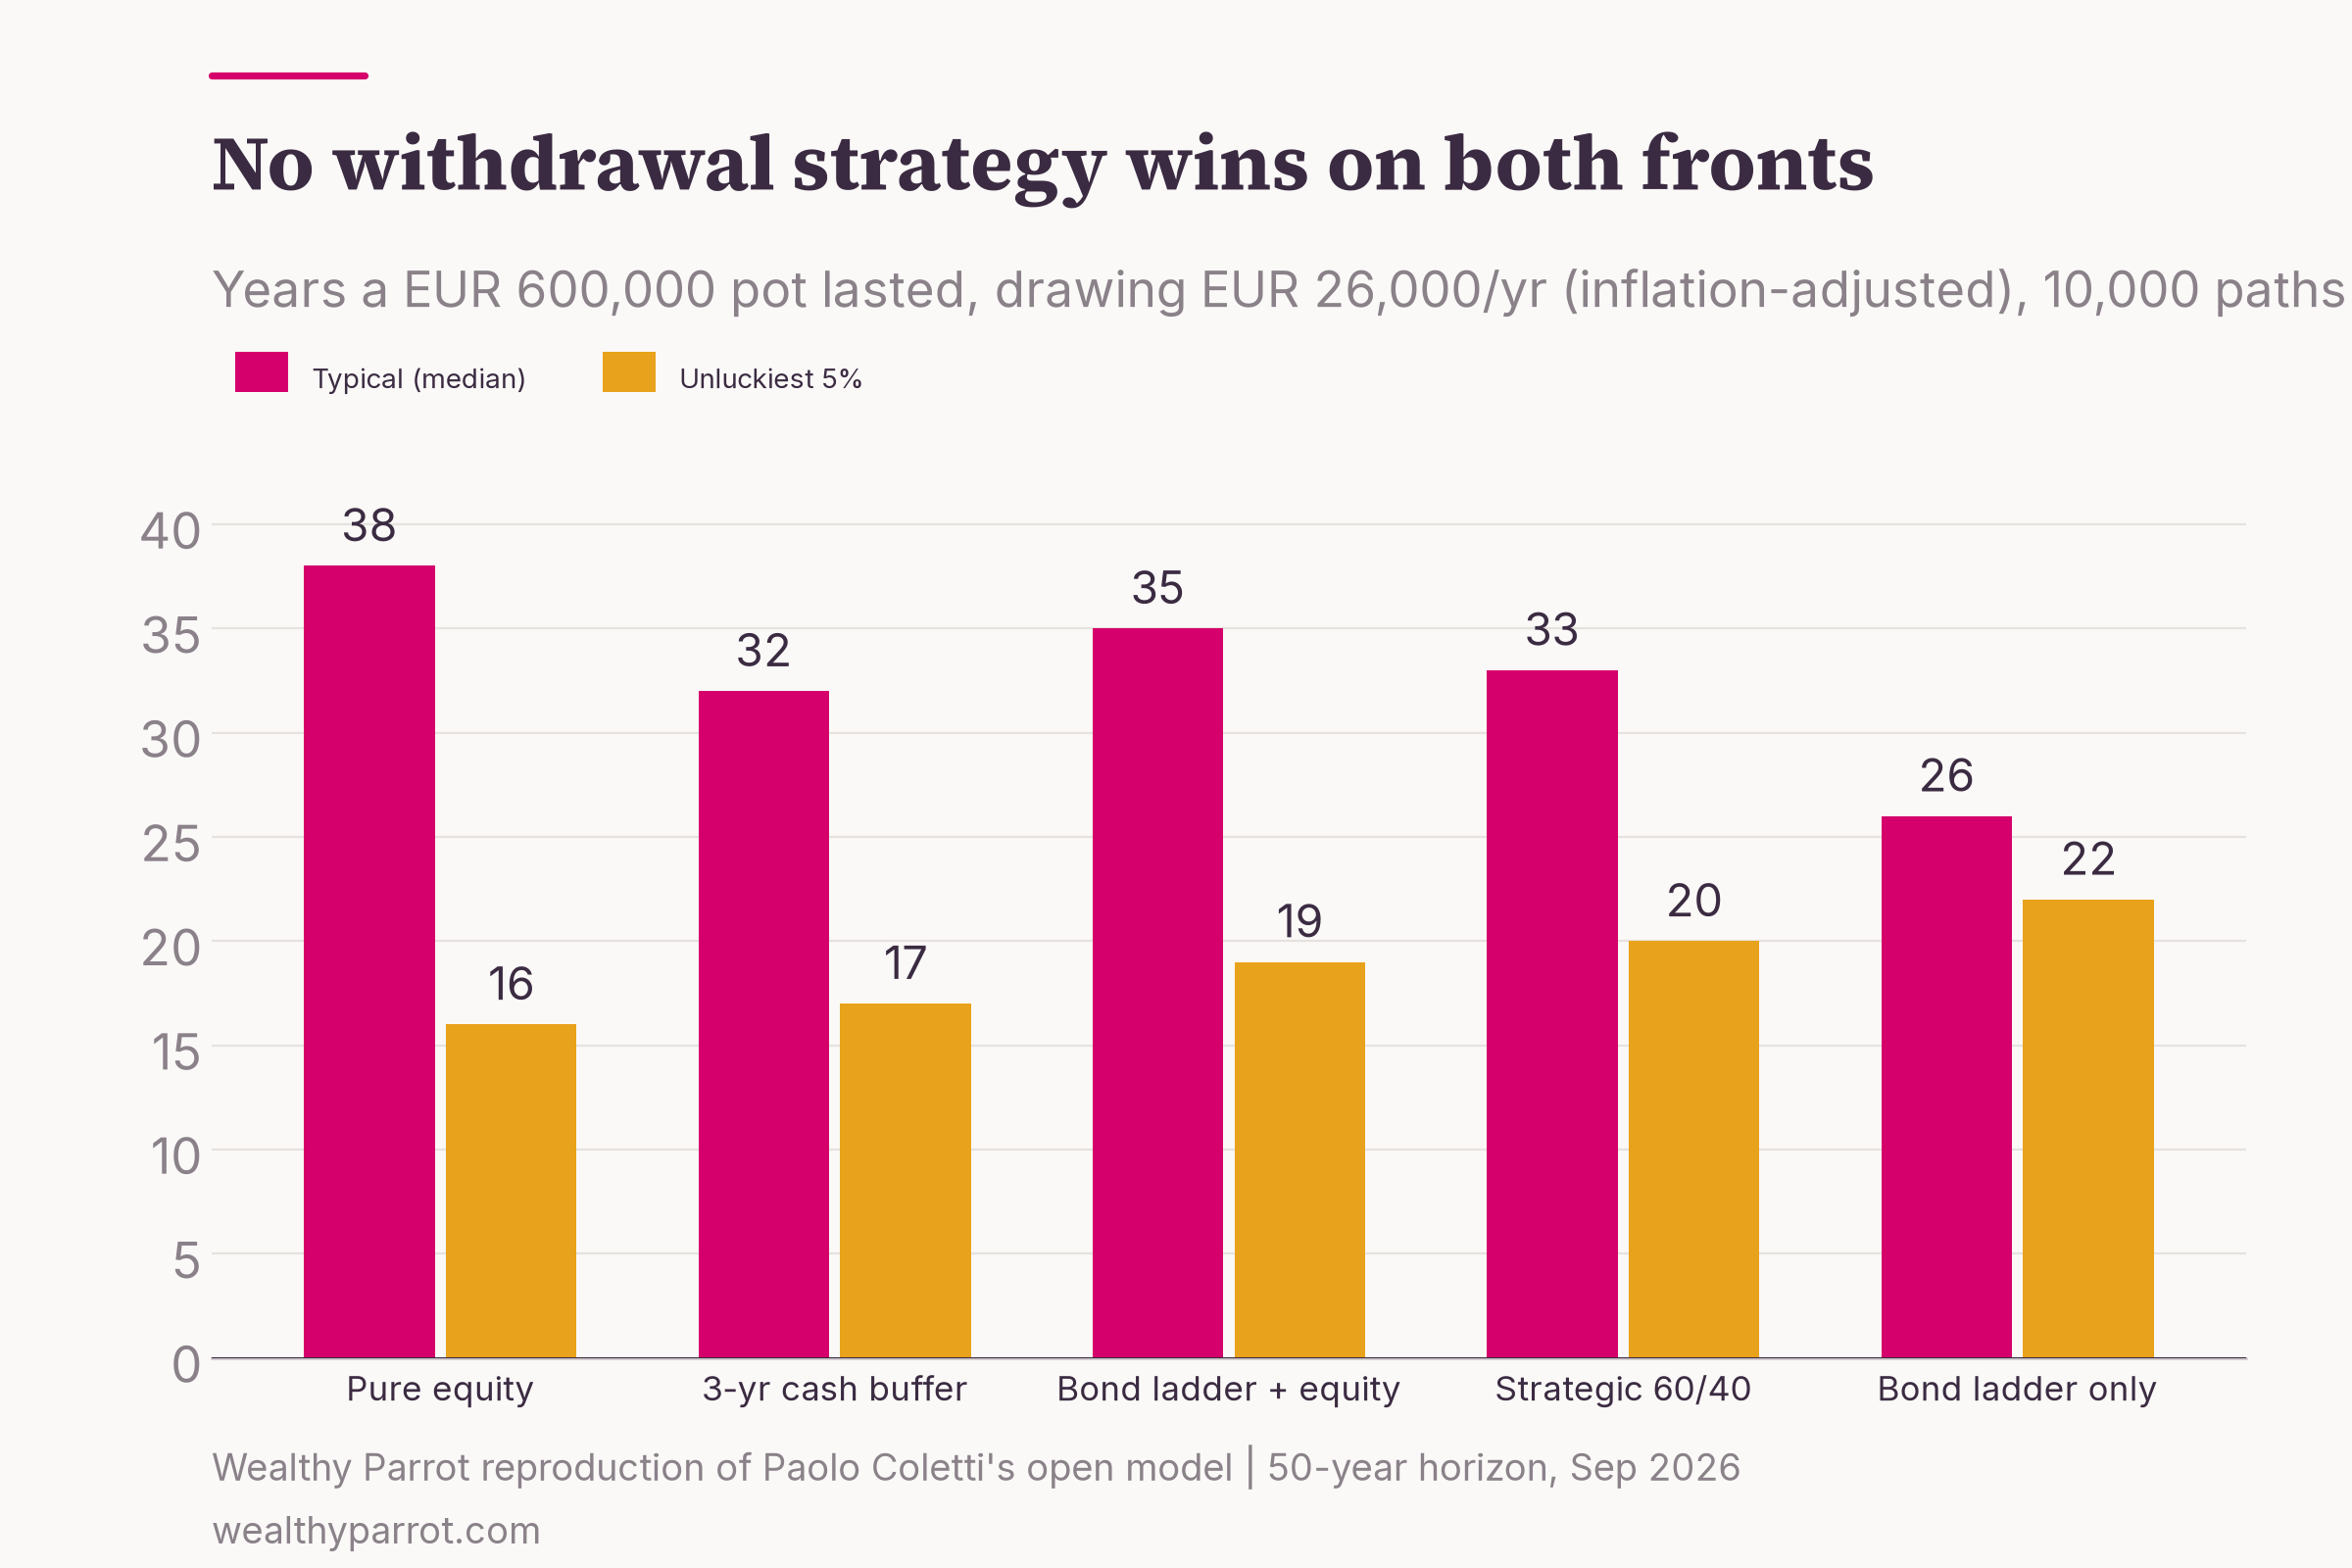
Fun fact: in my run, holding a large three-year cash buffer barely improved the worst-case outcomes at all - the unluckiest 5% still ran dry around year 17, no better than pure equity - while dragging the median result down. A wall of idle cash feels like safety and mostly just costs you growth.
The lesson is not that one strategy wins. It is that the aggressive portfolio buys you the best average outcome and the worst early-failure risk at the same time, and the whole craft of decumulation is managing that trade in the first decade.
The 4% rule is a research finding, not a law of physics
Almost everyone has heard of the 4% rule: withdraw 4% of your pot in year one, adjust that figure for inflation each year, and your money has historically lasted 30 years. It comes from Bengen's 1994 work and the follow-up Trinity Study by three professors at Trinity University. (Neither has a formal DOI, so you will not find them in an academic index - they reach us through the books that made them famous.)
What gets lost is how conditional that number is. Bengen's own later research puts the true historical "worst case" survivable rate - what he calls SAFEMAX - at around 4.7%, and the average survivable rate across 349 different retirement start dates between 1926 and 2013 at a remarkable 7.1%. In other words, most retirees could have spent far more than 4%. The rule is built entirely around the handful of terrible start years, which is exactly what a safe rule should do.
But the number also breathes with the conditions on the day you retire. Blanchett, Finke and Pfau argued in a 2013 Journal of Wealth Management paper that a safe withdrawal rate depends heavily on the yields available when you start - and back then, with government bonds near zero, they thought 4% looked optimistic. That cuts the other way today. A euro-area retiree can now buy a 10-year government bond yielding about 3.5%, and a US retiree a 10-year Treasury at roughly 4.95% (both mid-September 2026, per ECB and Federal Reserve data). Those are a far more generous starting point than the 2010s offered - though, as we have argued elsewhere, a fat headline yield is not the free lunch it looks like once inflation takes its cut. Burton Malkiel, meanwhile, has long argued for a more cautious 3.5% as a planning figure. The honest range is somewhere between 3.5% and 5%, and where you sit in it depends on your age, your flexibility, and the market you happen to retire into.
Which account do you sell from first?
Now the genuinely mechanical question, and a warning that comes with it.
There is no universal answer to withdrawal order, and that is not for lack of effort. Where researchers have built a rigorous one - James DiLellio and Daniel Ostrov's optimisation in Financial Services Review is the sharpest example - it is constructed entirely around a single country's account types and tax brackets (in their case US 401(k)s, IRAs and Roth accounts). Change the jurisdiction and the optimal answer changes with it. So treat what follows as a principle to understand, not advice to follow, and check your own rules or a local professional before acting.
The principle: most people retire holding money in three broad kinds of container. A taxable account, where you owe tax on gains as you realise them. A tax-deferred wrapper, where you pay tax on the way out (a 401k or traditional IRA in the US, many workplace and personal pensions elsewhere). And a tax-free wrapper, where qualifying withdrawals are untaxed (a Roth, a UK ISA, a French PEA once it matures, various pension-pillar structures across Europe). The order you draw them down changes how much tax you pay over a 30-year retirement, and therefore how long the money lasts.
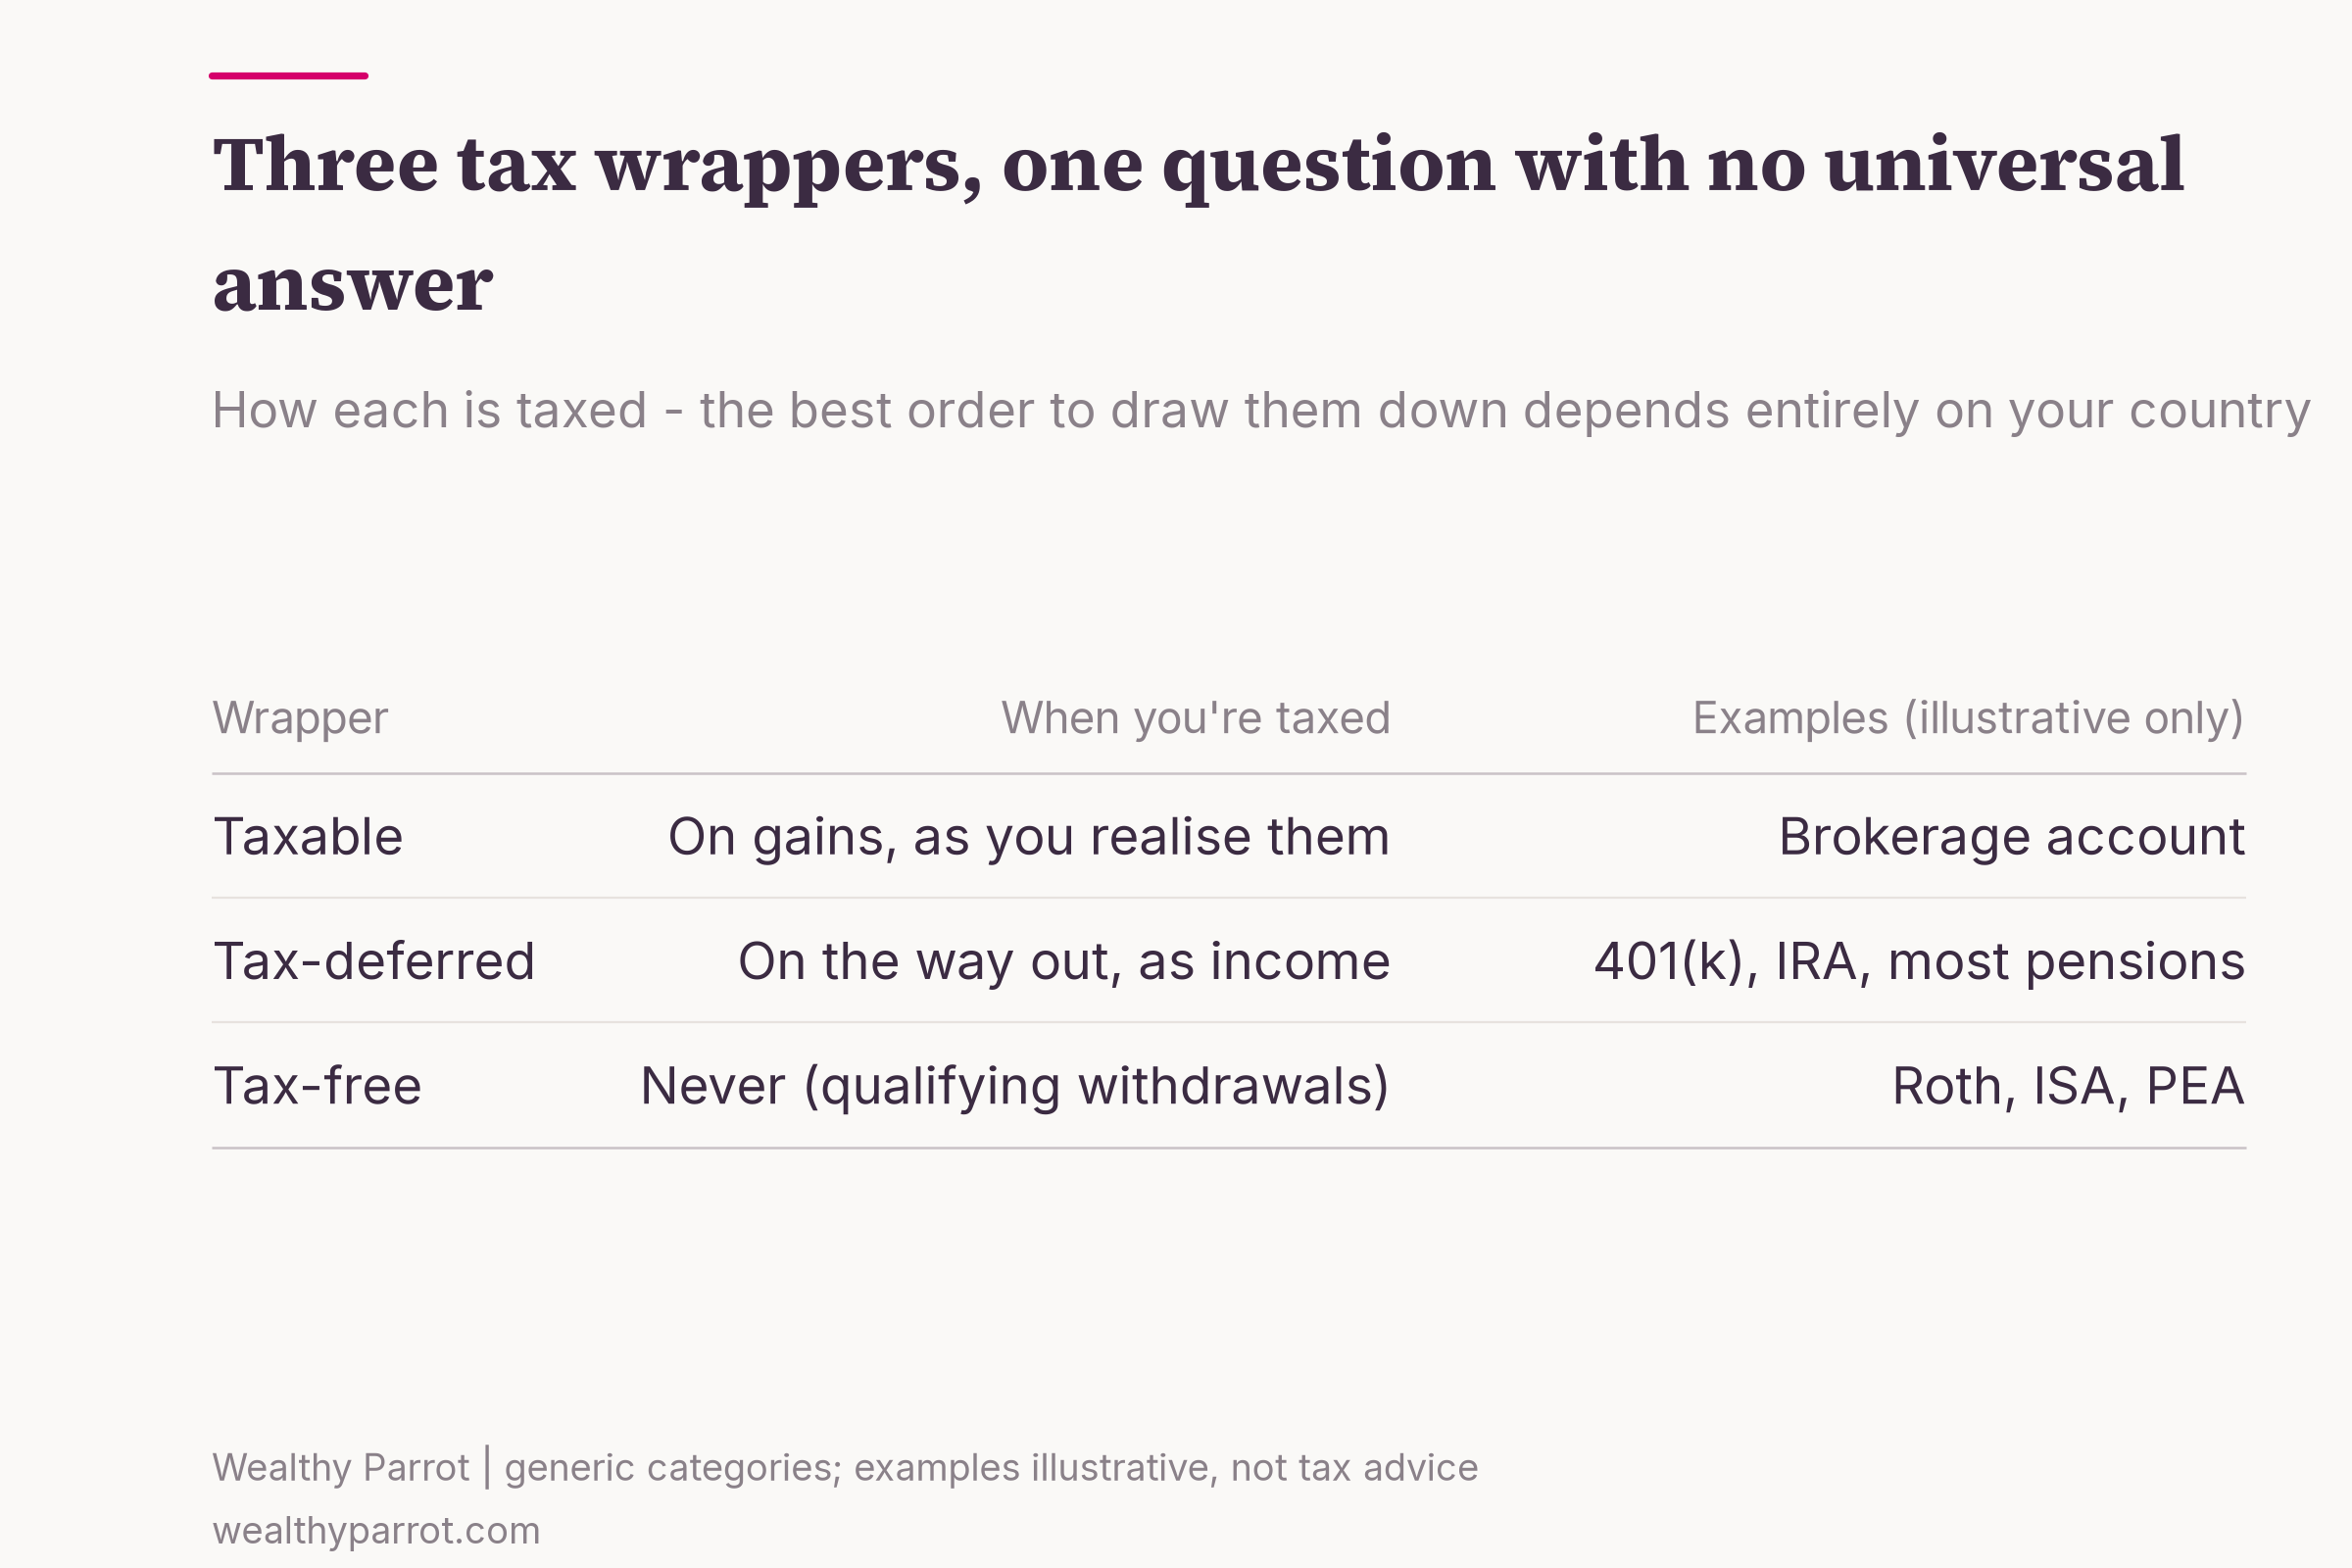
Here is the principle their maths keeps landing on, stripped of any one country's rules. The obvious order - empty the taxable account first, leave the sheltered ones to compound - is simple and often slightly wrong. Draining the taxable pot to zero can park you in very low tax brackets in your early retirement years, and then force large, heavily taxed withdrawals later, sometimes bunched together by mandatory-distribution rules. A smoother path spreads the realisations out: take a little from each type of account each year, or deliberately realise some income in the low-earning window right after you stop work, so no single later year gets hammered. DiLellio and Ostrov found that this kind of individualised, whole-retirement sequencing beat the naive "taxable-first" rule many institutions still hand out - by their estimates, the naive order can be 10 to 26% worse than an optimised one. What "a little from each" actually means for you is a question of your local tax code - which is exactly why there is no universal script.
Why it matters in cash terms: Bengen's research found that a portfolio paying about a 17% effective tax rate on its holdings saw its safe withdrawal rate fall from 4.7% to 4.0%. Tax drag is not a rounding error; it is most of a percentage point of your income.
Fun fact: one thing that is not a withdrawal strategy is letting the government decide for you. In several systems, tax-deferred accounts force you to take a minimum amount out each year once you hit a certain age - the US calls them required minimum distributions. Bengen is blunt that these are a tax rule, not a spending plan, and building your retirement income around them is letting the calendar drive the car.
There is one more mechanical tax trap worth naming, and Coletti's simulation quantifies it beautifully. Suppose you spend your working life in a single accumulating fund, and on the day you retire you decide to reorganise everything - sell the lot and move into bonds, or into an income portfolio. If that fund has doubled over your career, half of what you sell is untaxed gain. Realise all of it at once and, at a capital-gains rate of 26% (Italy's, in his model), you hand roughly 13% of your entire portfolio to the tax office in a single afternoon. The exact percentage depends on your country and your cost basis, but the mechanism is universal: switching strategy at retirement can cost you more than the switch is worth. The fix is equally universal - if you want to shift the shape of the portfolio, do it gradually over the years before you stop working, not in one taxable lump on your last day.
Tools for a bad first three years
If sequence risk is the disease, the treatments are all versions of the same idea: do not be a forced seller of shares when shares are cheap.
The simplest is a cash cushion. Kristy Shen and Bryce Leung, in Quit Like a Millionaire, describe keeping a bucket of cash - a couple of years of spending - that you live off only when markets are down, refilling it from the portfolio when markets recover. In a good year you sell shares to eat; in a bad year you leave them alone and spend the cushion. It is a mechanical rule that removes the worst decision, selling low, from your hands. Coletti's simulation is a useful reality check on how big that cushion should be: as we saw, a three-year wall of cash mostly just dragged returns, so the cushion is a scalpel, not a fortress. One or two years tends to be plenty.
There are more systematic versions of the same instinct. In Living Off Your Money, Michael McClung sets out a rule he calls Prime Harvesting: fund every withdrawal from bonds, and only sell equities to top the bonds back up once stocks have climbed more than 20% above their inflation-adjusted starting value. It is a mechanical way of guaranteeing you never sell shares into a slump, and in McClung's historical tests it outlasted simpler fixed-allocation approaches. You do not have to adopt his exact numbers - the point is that some rule decided in advance for what to sell in a bad year beats deciding in the moment, when fear is loudest.
Fun fact: even the timing of your annual withdrawal moves the needle. Bengen found that taking your money at the end of each year rather than the start lifted the safe rate from 4.45% to 4.90% - a nearly 10% raise in sustainable income for doing nothing but waiting a few months to sell. The pot gets to compound on money you have not yet spent.
The more active cousin is a set of guardrails: spend a bit less after a bad year, allow yourself a bit more after a good one. The best-known versions come from financial planners rather than journals - this is practitioner territory, not peer-reviewed science, so hold it loosely - but the instinct is sound. A retiree who can trim spending 10% in a downturn is far harder to bankrupt than one locked into a fixed, inflation-adjusted cheque. Rigidity is the real enemy.
Annuity or drawdown: the question underneath all of this
There is one way to make sequence risk vanish entirely: hand your money to an insurer and buy a guaranteed income for life. An annuity turns a pile of capital into a monthly cheque that never runs out, no matter how long you live or what markets do.
This question used to answer itself. For most of the twentieth century a company pension paid a guaranteed income for life, and the employer carried the risk of you living to 100. James Poterba, in his 2014 American Economic Review address, traced how the shift from those defined-benefit pensions to personal pots - the 401(k), the SIPP, the PEA - quietly handed that risk to each of us, at exactly the moment old-age lifespans were stretching out. Deciding whether to annuitise is really us doing a job our grandparents' employers used to do for them.
Robert Merton, who shared a Nobel for option-pricing theory, spent much of his later career making a more basic argument, one that Andrew Lo and Stephen Foerster capture in In Pursuit of the Perfect Portfolio: the whole industry measures the wrong thing. Retirement security, in Merton's telling, is a question about income - can you keep up your standard of living for the rest of your life? - not about the raw size of the pot. Framed that way, the truly safe asset for a retiree is not cash or short-term bonds but a stream of inflation-protected income for life - which is another name for an annuity.
Economists have a genuine puzzle here. Back in 1965, Menahem Yaari showed in the Review of Economic Studies that a rational person with no urge to leave an inheritance should convert all of their wealth into lifetime income. Almost nobody does. That gap between what the maths recommends and what people actually choose is famous enough to have a name - the annuity puzzle - and it is the honest place to start, because it means the answer is not obvious even to the people who study it.
The useful reframe comes from Bill Perkins in Die With Zero: treat an annuity as insurance. You are not trying to beat the market with it; you are insuring against the specific risk of living to 100 and outlasting your savings. Seen that way, the question is not "will I come out ahead" but "how much of my longevity risk do I want to offload." David Blanchett made a related argument in a 2022 Financial Analysts Journal paper: retirement strategies should be judged by the lifetime standard of living they deliver, not by the "failure rate" a Monte Carlo simulation spits out - a number that treats running out in year 31 the same as running out in year 3.
If someone tries to sell you one, Jill Schlesinger's script in The Dumb Things Smart People Do With Their Money is worth memorising: ask what you are paying in fees, what exactly is guaranteed, what happens to the money when you die, what it is invested in, and how the salesperson is paid. Good products survive those five questions. The ones sold hardest often do not.
The spending curve nobody puts in the model
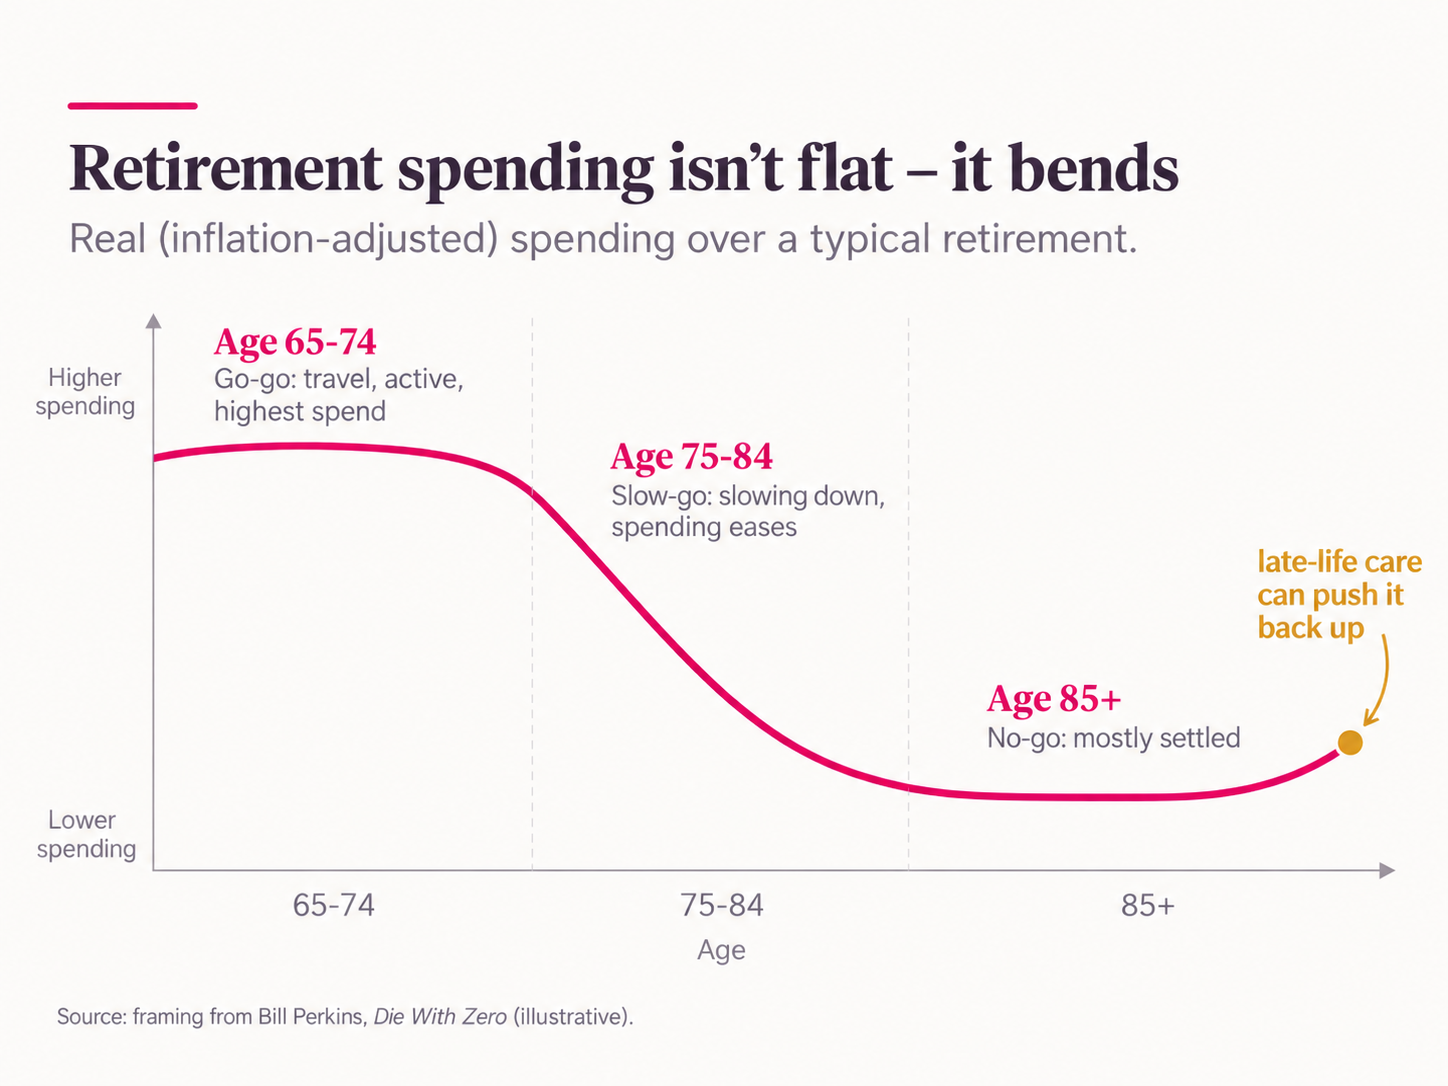
One last thing, because every model above quietly assumes you will spend the same inflation-adjusted amount at 85 as at 65. Real retirees do not.
Perkins and others describe a natural arc: the go-go years in your 60s, when you travel and spend; the slow-go years in your 70s, when you slow down; and the no-go years, when you mostly stay put. Spending, in real terms, tends to fall through retirement, right up until late-life care costs can push it back up. That means the flat-withdrawal models are conservative by design - they plan for you to spend like a 65-year-old for forty years, which almost no one does. It is a rare piece of good news in this topic: the honest arithmetic is probably on your side more than the scary simulations suggest.
Practical takeaways
- The first decade is the whole game. A crash in year two is a catastrophe; the same crash in year 25 is a footnote. Structure your retirement around protecting the early years, not maximising the average.
- Keep one to two years of spending in cash, and spend it only when markets are down. It removes the "selling low" decision from your hands. A bigger buffer than that mostly just drags your returns.
- Do not switch strategy in one lump on your retirement date. Realising a career's worth of gains at once can cost 10-15% of the pot in tax. If you want a different portfolio for retirement, migrate to it gradually in the years before you stop.
- Treat 4% as a starting point, not a commandment. It is a worst-case number; the historical average was far higher, and today's higher bond yields are a more forgiving backdrop than the 2010s. Stay flexible enough to trim in a bad year.
- Decide the annuity question on its own terms. It is longevity insurance, not an investment. Ask the five questions before you buy, and remember that partial annuitisation - covering your basic bills and drawing down the rest - is a legitimate middle path.
- The order you drain accounts in is a tax question with no universal answer. Learn the principle, then check your own country's rules.
Come back to the two retirees. They did everything the "how much do I need" articles told them to. They saved the same amount, bought the same fund, aimed at the same 4%. Everything that separated their two retirements happened after the finish line they were both so focused on - in the boring, unglamorous mechanics of taking the money out. That is the half worth learning. The pile is just the beginning.