The Greek alphabet conspiracy: why Wall Street's secret language can make you 15-25% richer
Greek letters in investing made simple: manage risk & return.

Picture this: You're at a cocktail party and some finance bro starts dropping "alpha" and "beta" like they're casting spells from Harry Potter. Your eyes glaze over. You nod politely. You secretly wonder if they're making this stuff up.
Every single investment decision you make is secretly controlled by eight Greek letters. They determine whether you'll panic-sell during the next crash, whether that "hot stock tip" from your brother-in-law will bankrupt you, and whether your retirement fund will actually let you retire. And once you crack this code? You'll spot opportunities (and dodge disasters) that 90% of retail investors completely miss.
Before we jump into the Greek alphabet, let's make sure we cover a couple fundamental concepts.
The risk-free rate
The risk-free rate is the return you can earn on an investment with theoretically zero chance of losing your money. Think of it as the baseline salary of the investment world - not glamorous, but it pays the bills and shows up reliably every month. Remember, as investor you are given a "reward" in exchange for you bearing the risk of owning an asset. The higher the risk, the higher the expected return.
As you can imagine there's actually no such thing as a truly risk-free investment. However 10-year Government bonds are generally considered as the safest assets you can buy as it's quite rare that a country defaults and can't pay back bonds.
Bottom line insight: Notice how dramatic these swings are? Your "boring" baseline just rode a bigger rollercoaster than most stocks! In 2009, $10,000 earned you $25/year. Today? That same $10,000 earns $500/year. Same safety, 20x the coffee money!
When you see an investment promising 15% returns, your first question should be "What's the risk-free rate right now?" If it's 3%, that investment is really promising you an extra 12% for taking on risk. On the other way, if the risk free rate is 14%, then the investment is kind of returning the same of a "boring" bond, potentially with a much higher risk.
Think of the risk-free rate as the financial equivalent of gravity - you might not think about it daily, but it affects absolutely everything:
- Your mortgage rate? Built on top of the risk-free rate
- Corporate bond yields? Risk-free rate plus a premium for corporate risk
- Stock valuations? Calculated using the risk-free rate as the baseline discount rate
When central banks mess with interest rates, they're essentially adjusting the financial gravity of the entire economy. Lower rates make everything else relatively more attractive; higher rates make cash and bonds suddenly competitive again.
Fun fact: when risk-free rates are practically zero, suddenly that "risky" stock market starts looking a lot more attractive. It's basic financial psychology - when the safe option pays nothing, people start taking bigger risks to get any real return.
Beta in finance: your portfolio's mood ring
Why am I not starting with Alfa? Because Beta is easier to understand. In finance, beta tells you exactly how your stocks behave compared to the market.
- Beta = 1: Your stock is the market's twin. Market up 10%? Stock up 10%.
- Beta > 1: Your stock is the market on steroids. More gains, more pain.
- Beta < 1: Your stock is the market on Xanax. Calmer, but also lazier.
- Beta < 0: Your stock is from the Upside Down. Market zigs, it zags. (Rare, like inverse ETFs)
Let's take a look at a few stocks and their beta.
High Beta rollercoasters:
- Tesla (TSLA): Beta 2.09 - The caffeinated squirrel on Red Bull
- NVIDIA (NVDA): Beta 1.68 - AI-powered rocket ship that makes your head spin
- Advanced Micro Devices (AMD): Beta 1.55 - Semiconductor mood swings personified
- Netflix (NFLX): Beta 1.45 - Streaming wars volatility
Market benchmarks:
- SPDR S&P 500 ETF (SPY): Beta 1.00 - The definition of market behavior
- Vanguard Total Stock Market (VTI): Beta 1.00 - Slightly broader universe, same energy
- Invesco QQQ (QQQ): Beta 1.15-1.25 - Tech-heavy energetic golden retriever
Defensive bunkers:
- Utilities Select Sector SPDR (XLU): Beta 0.67 - The sleepy koala that barely moves
- Consumer Staples SPDR (XLP): Beta 0.61 - Recession-proof groceries and toothpaste
- iShares 20+ Year Treasury (TLT): Beta -0.45 - Inverse correlation master class
Portfolio surgery using Beta: the step-by-step method
You can (and should) calculate the Beta of your entire portfolio, to assess how it is positioned against the market swings. To do so, you have to calculate the pondered average:
Portfolio Beta = Σ(Weight of each holding × Beta of that holding)
Example Portfolio:
- 40% SPY (Beta 1): 0.40 × 1.00 = 0.40
- 30% QQQ (Beta 1.15): 0.30 × 1.15 = 0.35
- 20% XLU (Beta 0.67): 0.20 × 0.67 = 0.13
- 10% TLT (Beta -0.45): 0.10 × (-0.45) = -0.05
Portfolio Beta = 0.40 + 0.35 + 0.13 + (-0.05) = 0.83
To avoid doing the calculation manually, especially when you start having a lot of stocks, you can use the Wealthy Parrot free calculator.
Rolling Beta for Tesla (TSLA)
A single Beta number is just a snapshot in time. A rolling Beta analysis reveals how an asset's market sensitivity changes over time, often in response to market cycles and business developments.
Tesla's Beta evolution:
- 2014-2016: Beta around 0.8-1.2 (growing but uncertain company)
- 2017-2019: Beta spiked to 1.8-2.2 (production hell and Elon tweets)
- 2020-2021: Beta hit 2.5+ during meme stock mania
- 2022-2024: Beta stabilized around 2.0-2.2 (mature but still volatile)
This shows how Tesla evolved from a regular growth stock to a high-beta momentum play, back to a somewhat more stable (but still wild) large-cap stock.
CAPM: the "Fair pay for risk" formula
Now that we covered some basics, we can move on to something slightly more complex - and interesting!
The Capital Asset Pricing Model (CAPM) is a fundamental asset pricing theory in finance that describes the relationship between systematic risk and expected return for assets, particularly securities. Developed in the mid-1960s by William F. Sharpe.
The logic behind CAPM is that investors deserve to get paid for two things: waiting around (time value of money) and dealing with actual risk. But CAPM only pays you for systematic risk, the scary stuff you can't diversify away no matter how many stocks you own. Think market crashes, recessions, or alien invasions that tank everything simultaneously. The model basically says "we're not paying you extra for putting all your eggs in one basket" because that unsystematic risk (company-specific disasters like CEO scandals or product recalls) can be eliminated by simply buying more variety.
The formula is
Ri = Rf + βi (Rm – Rf) where:
- Ri = Expected return on security I
- Rf = Risk-free rate of interest in a given market
- Rm = Expected return on the market portfolio. Normally the return from a broad stock portfolio (in a given market) is taken.
- βi (Beta) = Beta value for security I, representing its systematic risk
- (Rm – Rf) = Market Risk Premium. This is how much investors expect as extra return (from the stock market) compared to what they would get from risk free assets.
Alpha in investing: your fund manager's report card (spoiler: most are failing)
Most "professional" investors are professional at one thing - collecting your money. Alpha measures whether your investment genius actually earned their keep. Think of it as their report card, adjusted for how much risk they took.
It measures whether your investments delivered returns greater or less than the market after accounting for systematic risk. Think of it as the portion of your returns that can't be explained by simply riding the market's coattails.
Alpha = Actual Return - [Risk-free Rate + Beta × (Market Return - Risk-free Rate)]
Or you can read it as: Alpha = what you actually got - what you should have got based on risk
Real-world massacre example: Remember that mutual fund your financial advisor swore was "crushing it" with 9.5% returns? Well, the S&P 500 returned 11.2% that same year. After crunching the numbers (beta of 0.95, risk-free rate of 4.3%), that fund actually UNDERPERFORMED by 1.36%.
Translation: You paid someone to lose your money. You could've thrown darts at a stock list and done better.
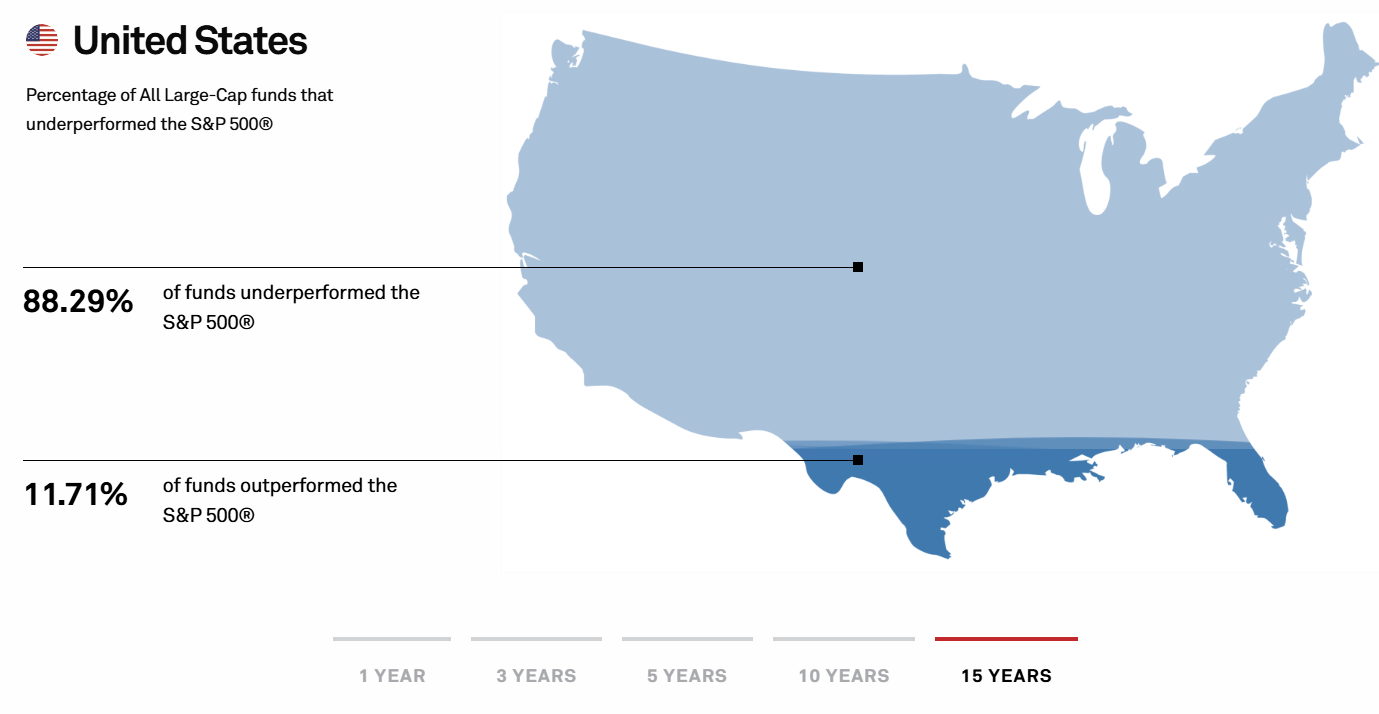
According to the 2024 SPIVA scorecard, 88% of large-cap fund managers underperformed the S&P 500. Eighty. Eight. Percent.
Fun fact: The Oracle of Omaha's Berkshire Hathaway has generated so much alpha that $1,000 invested in 1965 would be worth $55 million today (Source: Berkshire Hathaway Annual Reports). The S&P 500? A measly $391,540. That's what real alpha looks like—not your advisor's 1% "outperformance" before their 2% fee.
The Options Greeks quartet: Delta, Gamma, Theta, and Vega (AKA the four horsemen of the Options apocalypse)
If stocks are like driving a car, options are like flying a fighter jet while juggling flaming chainsaws. These four Greeks are your instrument panel - ignore them and you'll crash spectacularly.
Delta: your speedometer
Think of Delta as your option's speedometer-it shows you how fast your position is making or losing money.
- What it is: Delta tells you how much your option's price should change for every $1 move in the stock.
- Price change example: You own an Apple call option with a 0.50 delta. If Apple's stock rises by $1, your option's price will increase by about $0.50. Since a standard contract is for 100 shares, that's a $50 gain.
- Probability shortcut: Delta also gives you a rough estimate of the option expiring "in-the-money." A 0.50 delta suggests about a 50% chance the stock will close above your strike price at expiration.
How Delta looks in the real world (Apple stock at $185):
| Call Strike Price | Delta | Chance of Expiring In-the-Money (Roughly) |
|---|---|---|
| $180 (In-the-Money) | 0.65 | 65% |
| $185 (At-the-Money) | 0.52 | 52% |
| $190 (Out-of-the-Money) | 0.38 | 38% |
How the pros use it: Delta is crucial for managing risk. If a trader sells 100 call contracts with a 0.50 delta, they hedge this position by buying exactly 5,000 shares of the stock (100 contracts × 100 shares × 0.50) to remain "delta-neutral."
Gamma: your acceleration
If Delta is your speed, Gamma is your acceleration. It tells you how quickly your speed (Delta) can change. High gamma is like having a turbocharger-it can lead to explosive gains or losses.
- What it is: Gamma measures the rate of change in an option's Delta for every $1 move in the stock.
- The weekend risk example:
- Friday: You own an Apple $185 call that expires on Monday. The stock is also at $185. Your delta is 0.50, and your gamma is 0.08.
- Monday: Surprise news sends the stock up $5 to $190.
- Gamma's effect: Your delta doesn't stay at 0.50. It accelerates. The $5 stock move causes your delta to increase by 0.40 ($5 price move × 0.08 gamma).
- Your new Delta: Your option's new delta is now 0.90 (the original 0.50 + the 0.40 change). Your exposure just jumped from behaving like 50 shares to behaving like 90 shares-a massive change in risk and reward.
- Real-world explosion (The GameStop "Gamma squeeze"): During the 2021 GameStop mania, options had massive gamma. As the stock price shot up, the delta on call options rocketed towards 1.0 almost instantly. This forced firms that had sold the calls to buy GME stock aggressively to cover their rapidly growing risk. This frantic buying created a feedback loop that sent the stock price even higher. That's the explosive power of gamma in action.
Theta: the silent portfolio killer
Theta is every option buyer's enemy and every seller's best friend. Think of it as a relentless countdown clock-it measures the value an option loses every single day simply because time is running out.
- What it is: The amount of money your option's price will decrease each day. This decay happens 24/7, even on weekends and holidays when the market is closed.
- The brutal truth: An option with a theta of -0.05 is losing $0.05 from its price every day. For a standard contract (100 shares), that's a $5 daily loss paid to "theta gang."
- Decay is not steady: Time decay acts like a melting ice cube-it melts much faster as it gets closer to expiring. An option loses the majority of its time value in the last 30 days of its life.
How Theta speeds up
This chart shows how the daily decay for a typical at-the-money option accelerates as expiration gets closer.
| Days to Expiration | Example Daily Decay (Theta) |
|---|---|
| 90 days | -$0.02 |
| 60 days | -$0.04 |
| 30 days | -$0.07 |
| 14 days | -$0.12 |
| 7 days | -$0.20 |
| 1 day | -$0.50+ |
How to use this:
- If you're buying options, you are fighting against Theta. You need a stock to move significantly and quickly to outrun the daily time decay.
- If you're selling options, Theta is your best employee. It works around the clock to decrease the value of the option you sold, letting you keep the premium as profit.
Vega: the volatility vampire
Vega measures how much an option's price changes for every 1% change in implied volatility (the market's forecast of future price swings). It's especially important around big events like earnings reports.
- What it is: The sensitivity of an option's price to changes in market fear or uncertainty.
- The "Earnings trap" that gets everyone: You correctly predict a stock will jump after earnings, so you buy calls. The stock rises 5%, but you check your account and you've lost money. What happened?
- "Volatility crush":
- Before earnings: Uncertainty is at its peak. This inflates the option's price with high implied volatility.
- After earnings: The news is out, and all that uncertainty vanishes. Implied volatility "crushes" or plummets.
- The result: Vega, the volatility vampire, sucks the now-gone uncertainty premium right out of your option's price. This loss often wipes out any gains you made from getting the stock's direction right.
Real-world example - An earnings play:
- Before news: Implied volatility is 70%.
- After news: Implied volatility drops to 30%.
- The cost: An option with a vega of 0.10 would instantly lose $4 of its value from this volatility crush alone (a 40% drop × 0.10 vega × 100 shares).
- How to use this: When you buy an option, you're also making a bet on its volatility. Being right on the stock's direction isn't enough during events like earnings. Conversely, in a market panic, fear (and volatility) can spike, and high vega can cause your options to gain value even if the stock doesn't move much.
Rho: the forgotten Greek
For over a decade, when interest rates were near zero, Rho was the Greek that everyone ignored. Now that rates are higher, Rho is back, and it directly impacts the price of long-term options.
- What it is: Rho measures how much an option's price changes for every 1% change in the "risk-free" interest rate.
- Why it matters now: Higher interest rates increase the carrying cost of investments. This cost-or benefit-is priced into options, especially long-term ones.
- For Calls: Higher rates make call options slightly more valuable.
- For Puts: Higher rates make put options slightly less valuable.
- Simple example - Long-Term Calls (LEAPS):
- You own a two-year Apple call option with a Rho of 0.25.
- Interest rates rise by 2% (e.g., from 3% to 5%).
- Your option will gain $0.50 in value from the rate change alone (2×0.25 Rho). That's a $50 bonus per contract you wouldn't have gotten in a zero-rate world.
Key takeaway: Rho has the biggest impact on long-term options (LEAPS). If you're trading options that expire in a few weeks, you can safely ignore it. But if you're investing for a year or more, Rho is now a small but important factor in your option's price.
Sigma (volatility): your Portfolio's Richter scale
Sigma is the formal name for volatility. Think of it as a Richter scale for your investments-it tells you how wild the price swings are likely to be.
- What it is: A measure of how much an asset's price is expected to fluctuate. High sigma means a wild ride; low sigma means a calmer journey.
The reality check - volatility rankings:
| Asset | Annual Volatility (Sigma) | The Vibe |
|---|---|---|
| GameStop (GME) | ~90% | Meme stock insanity |
| Bitcoin (BTC) | ~67% | High-energy, twitchy |
| Tesla (TSLA) | ~52% | Elon's mood swings as a stock |
| Apple (AAPL) | ~28% | Surprisingly spicy for a "safe" tech |
| S&P 500 (SPY) | ~17% | The market's baseline |
| Utilities (XLU) | ~13% | Your grandmother's portfolio |
- What the number means: The S&P 500's historical volatility is around 17%. This means that in a typical year, it's normal for its return to be within a 17% range (plus or minus) of its average. Anything inside that range is just market noise.
- How to use this: Volatility sets expectations. When Tesla (52% volatility) drops 15% in a month, a rookie trader panics. A veteran trader yawns because that's completely normal behavior for that stock. It's like being surprised a roller coaster has loops.
Use sigma to match your personal risk tolerance. If you can't handle 30% swings, don't buy assets with 30% volatility. The math is telling you exactly what to expect.
Putting it all together: 3 enhanced case studies
Understanding the Greek letters is not about mastering complex formulas; it's about applying them to make more informed and deliberate portfolio decisions.
Case study 1: the conservative capital preserver
This portfolio is designed for an investor whose primary goal is to minimize losses and generate steady income, accepting lower returns in exchange for a smoother ride.
The setup:
- 45% Vanguard Total Bond Market (BND)
- 25% Utilities Select SPDR (XLU)
- 20% Dividend Aristocrats ETF (NOBL)
- 10% International Bonds (BNDX)
Real results (Jan 2019 - Dec 2024):
| Metric | Data | Analysis |
| Annual Return | ~5.1% | Modest returns, driven by dividends and defensive stocks. |
| Volatility (Sigma) | ~8.7% | Roughly half the volatility of the S&P 500. |
| Portfolio Beta | ~0.42 | Moves less than half as much as the overall market. |
| Total Expense Ratio | 0.11% | Very low cost. |
Greek-driven choices: The core of this strategy is a low Beta, aiming to protect capital during market downturns. The portfolio is anchored by bonds (BND, BNDX) and low-volatility, defensive stocks (XLU, NOBL).
The reality of this period: This portfolio's main strength was its performance during the 2022 bear market, where it lost significantly less than the S&P 500. However, the heavy bond allocation (high Rho sensitivity) acted as a major drag when interest rates rose sharply. This case study shows the trade-off: you sacrifice high returns in exchange for stability and sleeping well at night during market chaos.
Case study 2: the balanced global diversifier
This is a classic "set it and forget it" portfolio for an investor seeking a mix of growth and stability with a global footprint.
The setup:
- 40% Total US Stock Market (VTI)
- 20% International Developed Markets (VEA)
- 15% Total US Bond Market (BND)
- 15% Real Estate (VNQ)
- 10% US Small Cap Value (VBR)
Real results (Jan 2019 - Dec 2024):
| Metric | Corrected Data | Analysis |
| Annual Return | ~9.6% | Solid, market-like returns capturing global growth. |
| Volatility (Sigma) | ~15.6% | Significant price swings are expected. |
| Portfolio Beta | ~0.91 | Tracks the broad market closely but is slightly less volatile. |
| Total Expense Ratio | 0.05% | Extremely cheap and efficient. |
Greek-Driven choices: This portfolio targets a Beta close to 1.0 by building a core of diversified index funds. It aims to capture the market's return efficiently without making aggressive bets. Tilts toward international stocks, real estate, and small-cap value provide diversification benefits.
The reality of this period: This portfolio effectively captured the growth of the US stock market while being anchored by other assets. However, the 15.6% volatility is crucial-it shows that "balanced" does not mean "risk-free." An investor would have had to endure significant drawdowns (like in early 2020 and all of 2022) to achieve these returns. The main advantage here is its simplicity and extremely low cost.
Case study 3: the high-growth tech enthusiast
This portfolio is for an investor with a high-risk tolerance and a long time horizon, aiming to maximize capital appreciation by concentrating on high-growth sectors.
The Setup:
- 35% Technology ETF (XLK)
- 25% US Growth ETF (VUG)
- 20% Emerging Markets (VWO)
- 15% US Small Cap Growth (VBK)
- 5% ARK Innovation ETF (ARKK) - A proxy for high-risk, disruptive tech
Real results (Jan 2019 - Dec 2024):
| Metric | Corrected Data | Analysis |
| Annual Return | ~14.5% | Very high returns, but with extreme volatility. |
| Volatility (Sigma) | ~26.1% | A true roller coaster; massive swings are guaranteed. |
| Portfolio Beta | ~1.32 | Amplifies market movements significantly in both directions. |
| Total Expense Ratio | 0.11% | Reasonable for such a targeted, aggressive strategy. |
Greek-Driven choices: The strategy is to maintain a high Beta (above 1.2) by focusing on the most aggressive market sectors. This investor embraces high Sigma (volatility), understanding that huge drawdowns are the price of admission for potentially spectacular returns. Assets like ARKK and VWO are notoriously volatile.
The reality of this period: This portfolio is a story of extremes. It would have generated breathtaking returns in 2020 and 2021, only to suffer a catastrophic crash in 2022. The final 14.5% annual return is excellent, but it required an iron will to not sell during the deep losses. This strategy shows that while high beta and high sigma can lead to wealth, they can also lead to ruin without discipline and a very long time horizon.
From novice to navigator: your new investment compass
You've just decoded the language of investing. The Greek letters are not abstract jargon; they are a practical toolkit for making smarter decisions.
They allow you to measure your portfolio's true risk (Beta, Sigma), grade its actual performance (Alpha), and control advanced strategies using options (Delta, Gamma, Theta, and Vega).
This knowledge empowers you to stop guessing and start building a portfolio that truly fits your goals. You're no longer just a passenger in your financial journey-you're the navigator.