Decoding GDP: the measure of a Nation's economy


Gross Domestic Product, or GDP, is a term we often hear thrown around in economic news. But what exactly does it mean? Simply put, GDP is the total value of all final goods and services produced within a country's borders over a specific period, usually a year. It's essentially a giant scorecard that tells us how big and healthy an economy is.
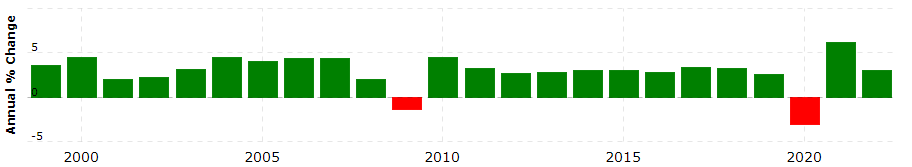
Fun fact: during the post-World War II economic expansion, the U.S. GDP grew at an average rate of about 4.3% per year from 1947 to 1973. This period, often referred to as the "Golden Age" of capitalism, was marked by widespread prosperity and booming investment opportunities!
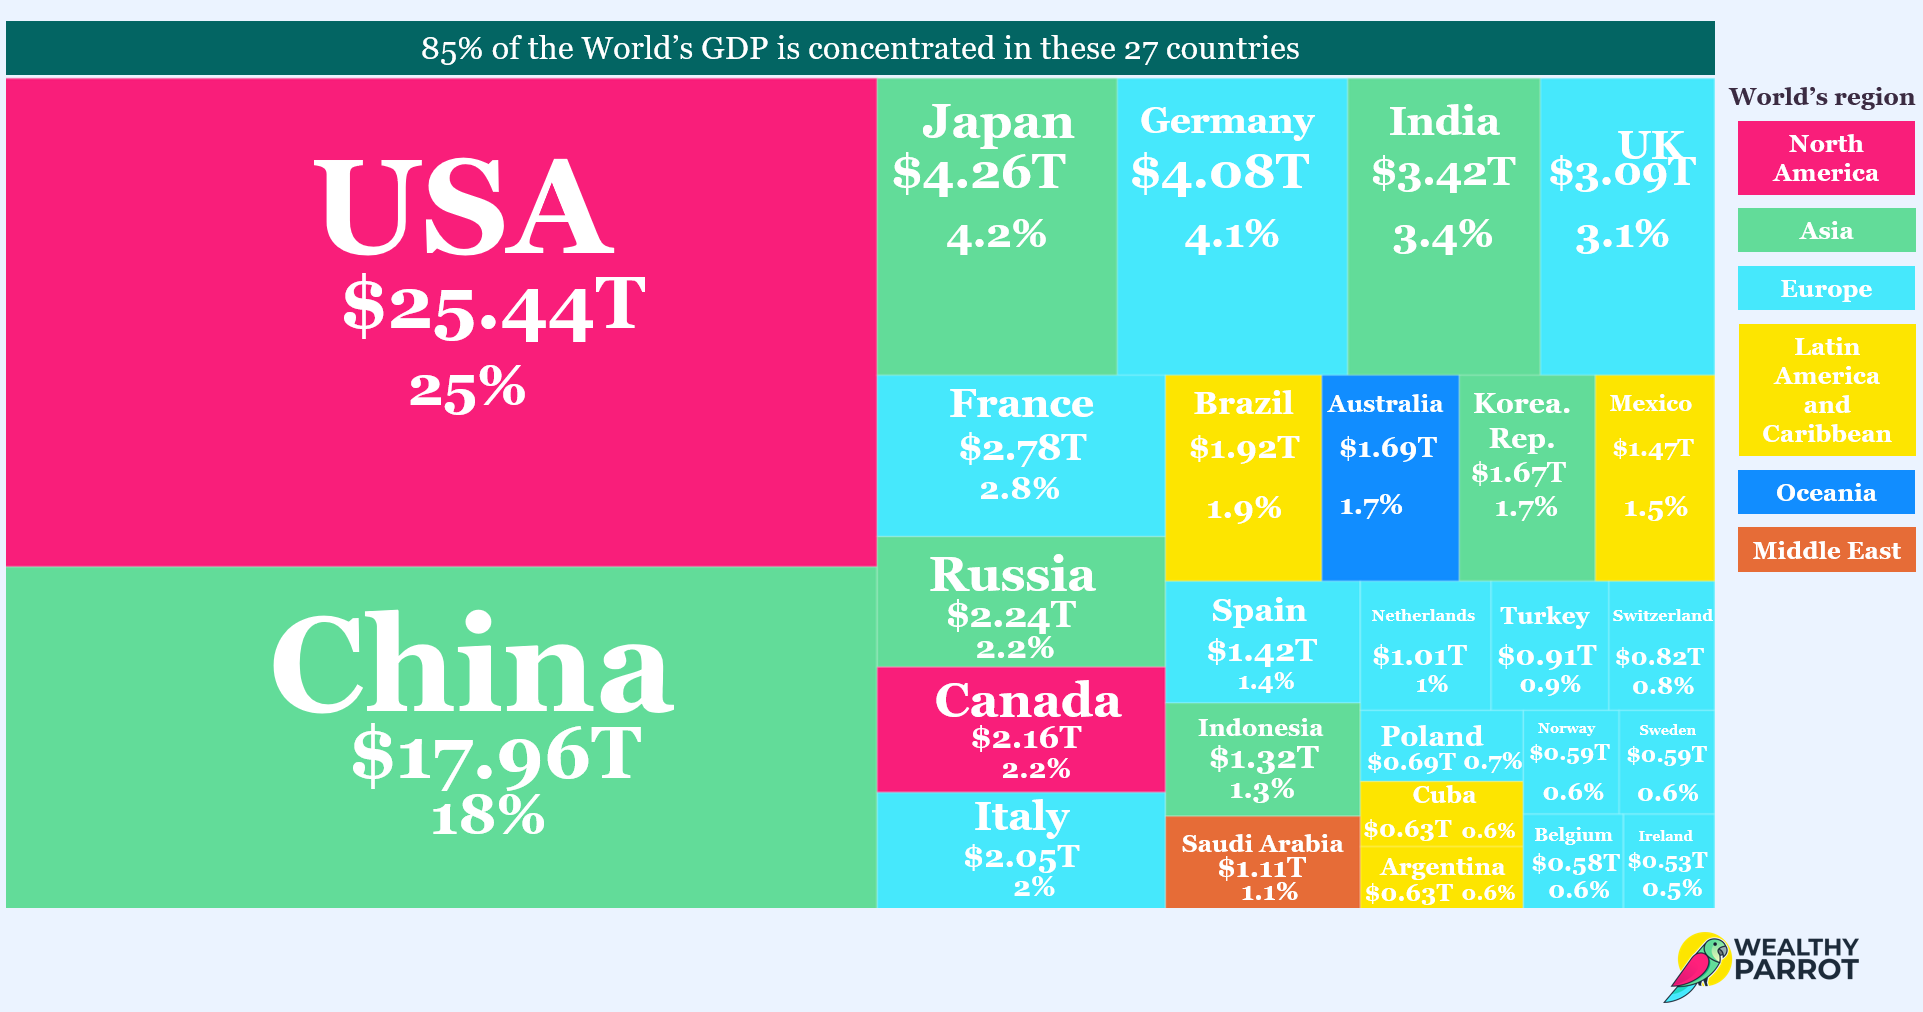
Here below you can see the countries with the biggest GDP in the world. It's worth noticing that 85% of the World's GDP is concentrated in 27 countries, with USA and China adding up to almost 40%!
How is GDP calculated
So how do economists calculate this colossal number? There are actually three main approaches, that in theory should give the same total GDP figure:
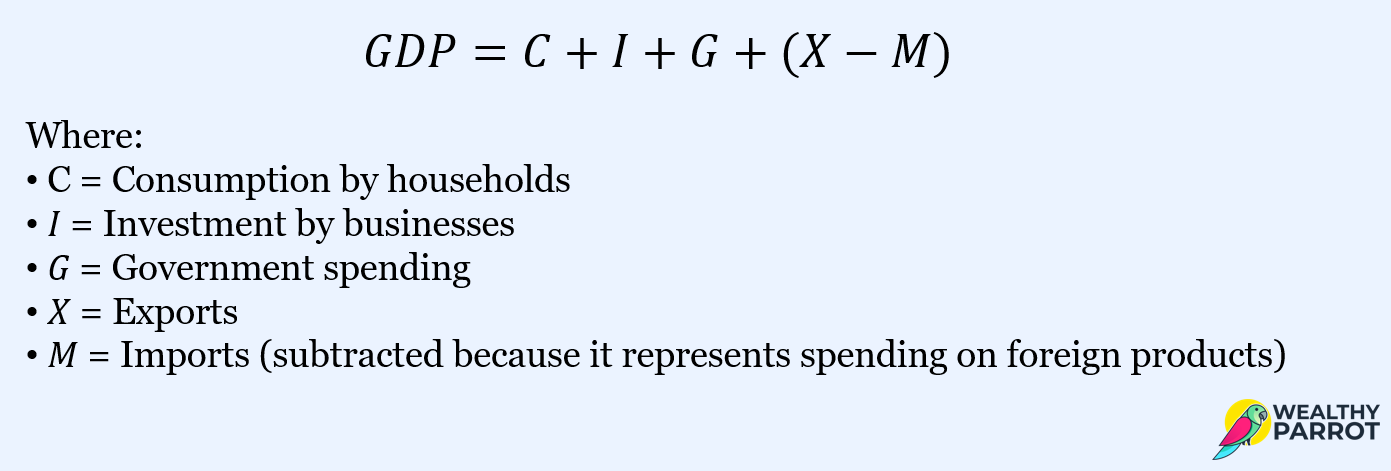
- Expenditure approach: this is the most common way to calculate GDP. It looks at how much money is spent by consumers, businesses, and the government on final goods and services. Think of it like adding up everyone's shopping carts. During festive seasons, like Christmas, consumer spending can cause noticeable bumps in GDP figures due to the surge in shopping and festivities! It can be summarized with the formula:
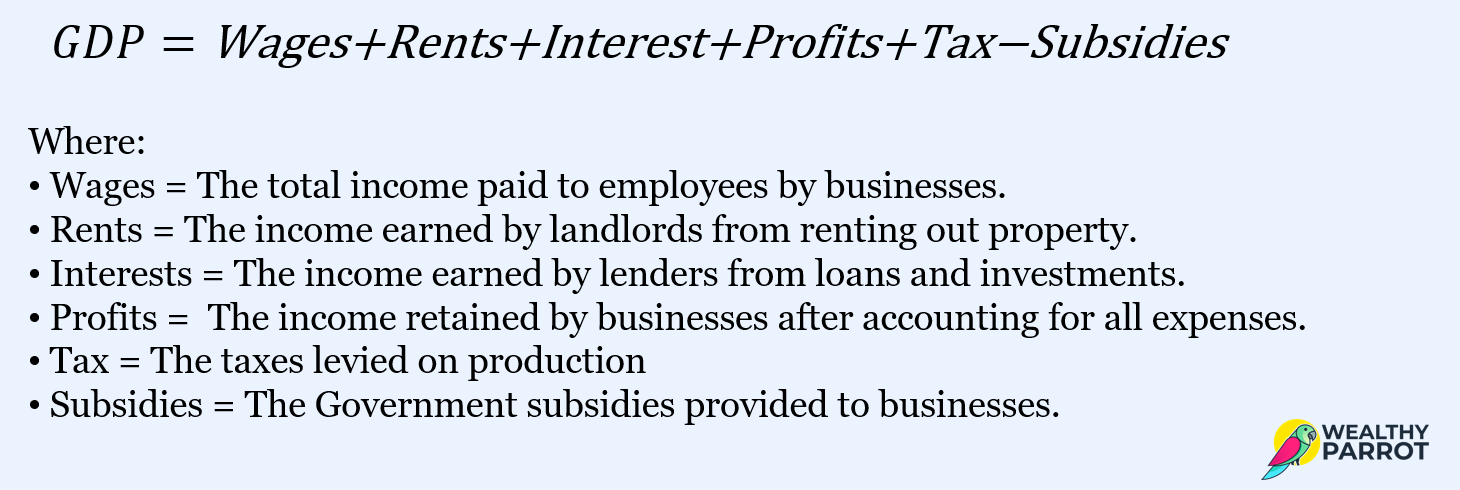
- Income approach: this method focuses on the income generated by all production in the country. It includes wages, salaries, rent, and profits. Imagine adding up everyone's paychecks. The formula can be represented as:
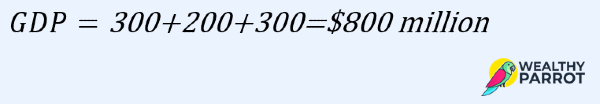
- Production approach: also known as the value-added approach, this approach calculates the value added at each stage of production, from raw materials to finished goods. It's like adding up the value a product gains at each step. To make it easier to understand, let's use an example.
Consider a country that only produces bread: wheat growers sell their wheat to a mill for $300 million (value added by farmers). The mill processes the wheat into flour and sells the flour to a bakery for $500 million. The value added by the mill is $200 million. The bakery makes bread and sells it to consumers for $800 million. The value added by the bakery is $300 million. Using the production approach:
The impact of GDP on the economy
GDP is a critical economic indicator that reflects the overall health of an economy. It has far-reaching impacts on a nation's economy, affecting everything from government policy and investment strategies to the standard of living and employment rates. Let's explore a few examples:
- Government policy: policymakers rely on GDP data to make decisions. A rising GDP might indicate the need for higher interest rates to prevent inflation, while a falling GDP might prompt government spending programs to stimulate the economy. In the 1990s, Japan experienced what is commonly referred to as the "Lost Decade," a period of economic stagnation and minimal GDP growth. The Japanese government responded with various fiscal policies aimed at stimulating growth, including large-scale infrastructure projects and lowering interest rates. Despite these efforts, the sluggish GDP growth led to prolonged deflation and limited effectiveness of traditional monetary policy tools, prompting a shift towards more unconventional measures like quantitative easing.
- Investor sentiment and market performance: investors also use GDP as a gauge of a country's economic health. A strong GDP suggests a stable environment for investing, while a weak GDP might lead investors to hold off on putting their money into that particular economy. Starting in 1991, India undertook significant economic reforms that led to a surge in its GDP. The liberalization included reducing tariffs and import duties, deregulating markets, and privatizing state-owned enterprises. This boost in GDP growth attracted foreign investments and revitalized the Indian stock market, leading to an era of robust economic expansion that helped to raise millions out of poverty.
- Employment and wage levels: after the 2008 global financial crisis, Germany witnessed a decline of almost 6% in GDP. However, swift government action and cooperation with businesses led to a quick rebound. The use of policies like Kurzarbeit (a special short-time working program) helped prevent massive layoffs, and as GDP recovered, Germany experienced low unemployment rates compared to other European nations.
- Public services and infrastructure: Qatar’s economic strategy involves leveraging its high GDP per capita, largely due to its natural gas reserves, to invest in large-scale infrastructure projects. In preparation for the 2022 FIFA World Cup, substantial investments were made in building stadiums, transportation networks, and hospitality facilities, significantly enhancing the country's infrastructure and potentially boosting its GDP through increased tourism and global visibility.
- Standard of living: China's rapid GDP growth over the last few decades has been instrumental in transforming the country from a low-income nation to a major global economic power. This growth has led to unprecedented improvements in the standard of living for hundreds of millions of people, lifting more than 800 million out of poverty since the economic reforms began in 1978. Higher GDP has enabled greater government spending on healthcare, education, and social services, contributing directly to better living conditions.
Ideal or minimum growth ratio
There isn't a universally ideal GDP growth rate as it can vary widely depending on the country, its level of development, its economic goals, and other factors. However, there are some general guidelines:
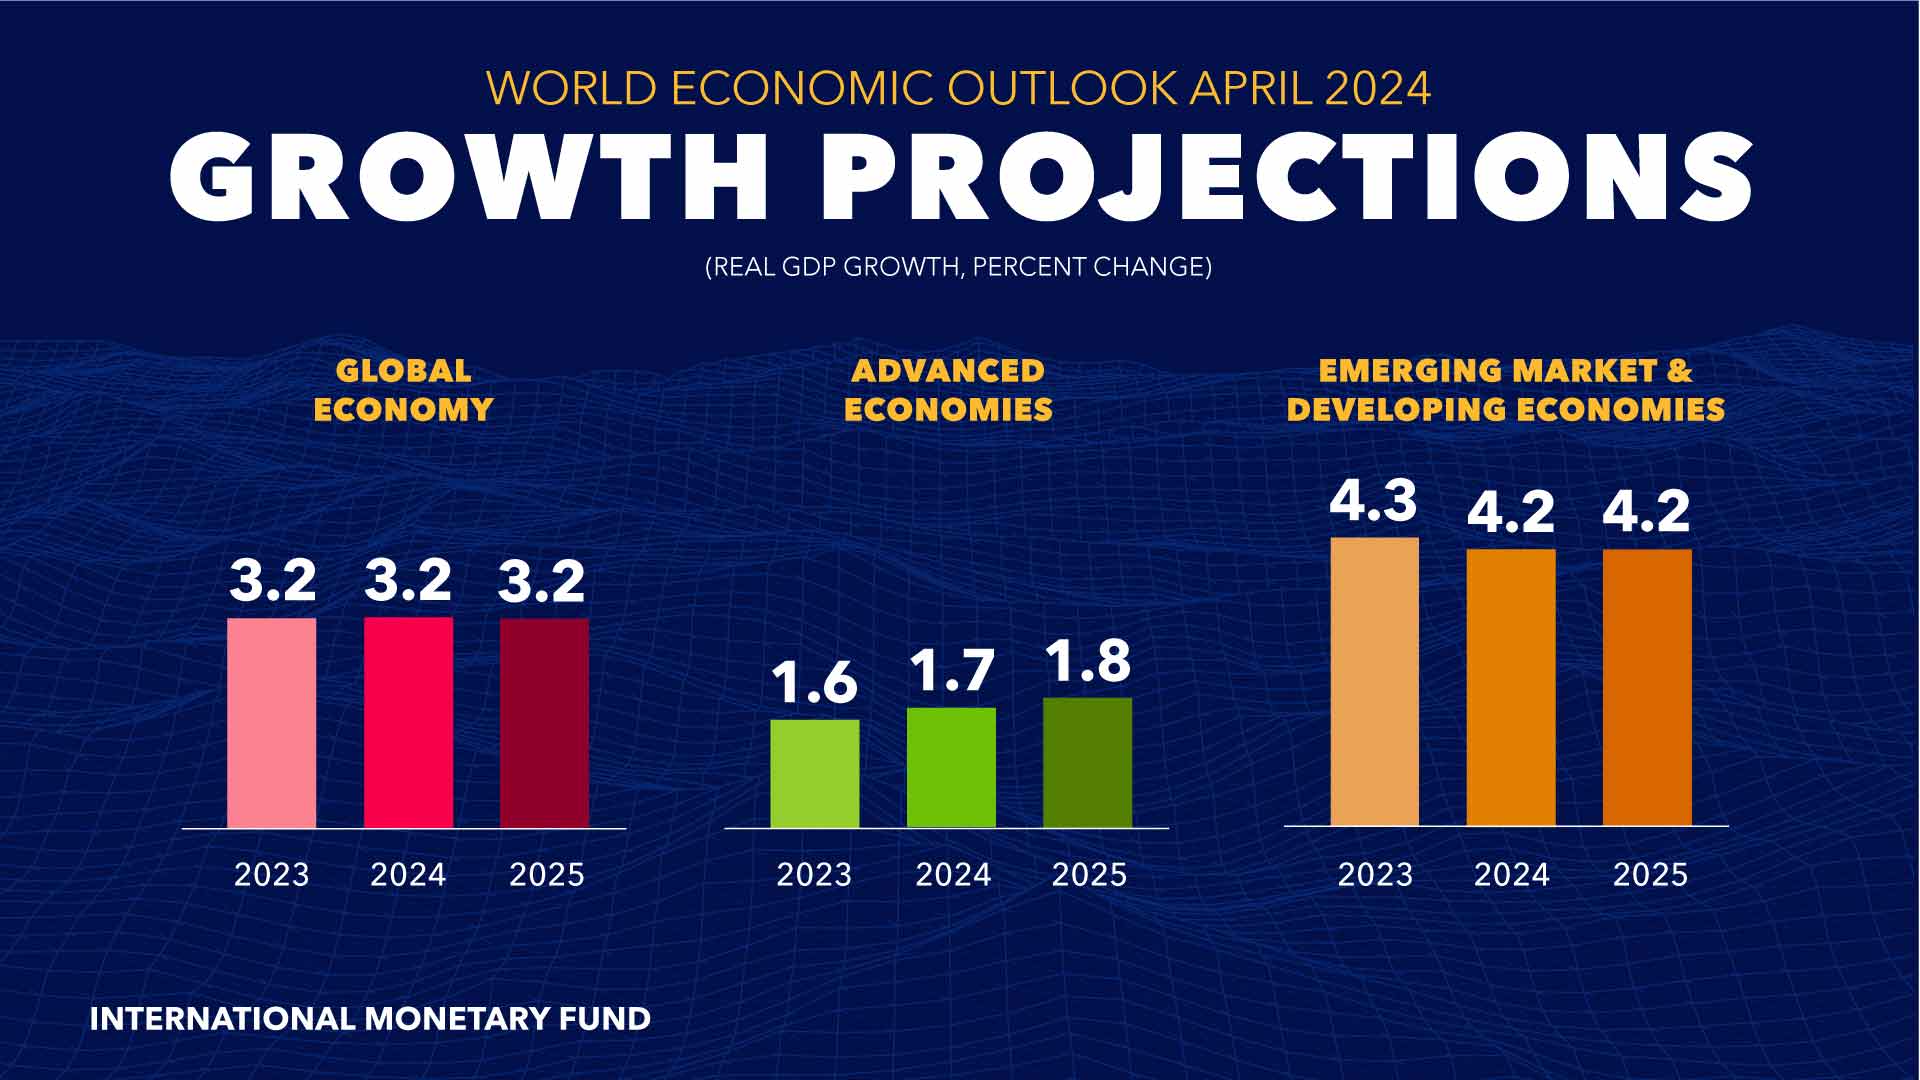
- Developed countries: for many developed nations (e.g. US, Europe, Australia), an annual GDP growth rate of 2-3% is often considered healthy. This range is sustainable and likely to result in stable job growth, low inflation, and improved living standards.
- Developing countries: developing nations (e.g. India, Vietnam, or even China) on the other hand, often aim for higher rates, typically 5-7% or more, to rapidly improve living standards and catch up with developed economies. These countries have more room to grow and can sustain higher rates without as much risk of inflation.
- Minimum growth rate: the minimum growth rate is often considered to be just above the population growth rate. This ensures that the GDP per capita (or economic output per person) does not decrease. If a country’s GDP growth rate is lower than its population growth rate, it may lead to a lower GDP per capita, potentially reflecting a decline in living standards.
What GDP per capita means
Gross Domestic Product (GDP) per capita is a key metric used to assess a country's economic well-being. Calculating GDP per capita is straightforward:

GDP per capita essentially reflects the average amount of economic output per person in a specific area, usually a country, and is calculated over a defined period, typically a year.
There are two main ways to calculate (and compare) GDP per capita:
- Nominal GDP per capita: this uses the current exchange rate to convert GDP into a single currency, typically US Dollars. It's a straightforward calculation but doesn't account for differences in the cost of living between countries.
- Purchasing Power Parity (PPP) adjusted GDP per capita: PPP considers the relative cost of goods and services in different countries, providing a more accurate picture of living standards.
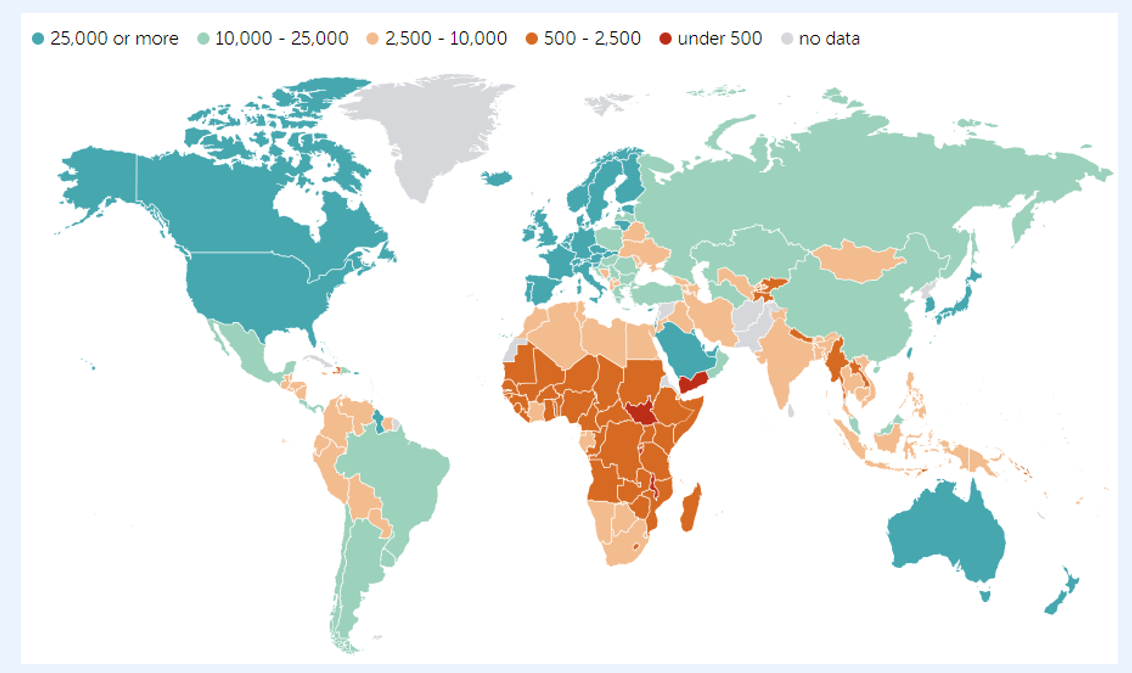
In the map above you can see the different levels of GDP per capita across the world. Don't forget that those are brackets, hence the actual values might be sensibly higher for some countries. The highest values in the world are:
- Luxembourg: $131k
- Ireland: $106k
- Switzerland: $106k
- Norway: $95k
- Singapore: $88k
- USA: $85k
Please note that this is obviously NOT the average salary of the population.
Why is GDP per capita important?
While not a perfect measure of individual wealth, GDP per capita offers a valuable snapshot of a country's economic performance. It can be used to:
- Compare living standards across countries: a higher GDP per capita often indicates a greater capacity to afford basic necessities and a higher quality of life.
- Track economic growth: an increase in GDP per capita over time suggests a growing economy and potentially improving living standards.
- Inform investment decisions: investors may consider GDP per capita when evaluating potential markets for their businesses.
It's important to remember that GDP per capita has limitations:
- Doesn't account for inequality: it averages out wealth across the population, which can mask income inequality.
- Excludes non-market transactions: it doesn’t capture unpaid services like volunteer work or household chores (or black market labor).
- Quality of goods and services: it measures quantity over quality, which can give a skewed perspective of living conditions.
GDP vs GNP
Gross Domestic Product(GDP) and Gross National Product (GNP) focus on slightly different aspects of economic health:
- GDP: focuses on location. It measures the total market value of all final goods and services produced within a country's borders during a specific period. Imagine a factory located in France – its output contributes to France's GDP, regardless of who owns the factory.
- GNP: emphasizes nationality. It measures the total market value of all final goods and services produced by a country's residents, irrespective of their location. So, if a US company has a factory in China, the factory's output would be included in China's GDP but the US's GNP.
The choice between GDP and GNP depends on the specific economic aspect you're analyzing:
- Overall economic size: GDP provides a clearer picture of the total economic activity happening within a country's borders.
- Global economic integration: a significant difference between GDP and GNP can indicate a country's level of integration with the global economy. For instance, a high GNP relative to GDP suggests a nation's residents have substantial overseas investments.
Most countries today prioritize GDP as the primary metric for economic measurement. This is because globalization has made it increasingly complex to track ownership and production locations. Additionally, GDP offers a more straightforward measure of economic activity within a nation's borders.
What's the impact when investing?
After all these details on GDP, you might wonder, "why should I care on GDP when investing?". It turns out, it should influence your asset allocation.
First of all, developed and developing (a.k.a emerging) markets do have different growth rates, and this is reflected in the asset returns. Higher returns also will mean higher risk of fluctuations.
Different sectors of the economy may contribute to GDP growth variably. For example, if a country's GDP growth is driven by technology and consumer services, it might be wise to look into tech stocks or ETFs that focus on these sectors. On the other hand, a slump in GDP may highlight risks or sectors to avoid.
Fun fact: pretty much every ETF or fund allocates money based on market capitalization, therefore you will more often than not have A BIG weight on US listed companies, and might not have companies listed in China or Japan, even though their GDP is among the biggest in the world.
A rising GDP often indicates a growing economy. This can translate to several factors attractive to investors:
- Increased corporate profits: Businesses tend to sell more goods and services in a growing economy, leading to higher profits. This can make stocks in those companies more appealing.
- Higher risk appetite: Investors may be more willing to take on risk when the economy is strong, potentially leading to higher returns on stocks and other riskier investments.
- Lower bond returns: Strong GDP growth can sometimes lead to rising interest rates, making bonds a less attractive option compared to stocks.
On the other hand a stagnant or declining GDP can signal a weak economy, potentially leading to:
- Lower corporate profits: Businesses may struggle to sell goods and services, leading to lower profits and potentially stock price declines.
- Lower risk appetite: Investors may be more cautious and seek safer havens for their money, such as bonds.
- Higher bond returns: Bonds may become more attractive relative to stocks when economic growth is weak, potentially leading to higher bond yields.
Looking Back, Moving Forward
GDP is a powerful tool for understanding the health of a nation's economy. While it's not a perfect measure of well-being, it provides valuable insights for policymakers, investors, and anyone interested in the economic landscape. Tracking historical GDP data allows us to identify patterns and trends. Periods of economic boom typically see a rise in GDP, while recessions are marked by a decline. Analyzing these trends helps us understand the factors that influence economic growth and prepare for future fluctuations. So, the next time GDP figures are announced, consider the wider story they tell about our world’s economic landscape.