How much of your world ETF is one bet on AI?


Open the factsheet of the MSCI World index, the benchmark that several "world" ETFs track, and read the top of the list. Nvidia is 5.81%, Apple 5.41% and Microsoft 4.00%. Together those three companies are 15.2% of an index that holds 1,249 companies in 23 countries.
Now look for Europe. The 386 companies of developed Europe, from ASML and SAP to Nestlé, Shell and Santander, add up to about 15.1% of the same index. Three American companies outweigh a whole continent's stock market, inside a fund that many European savers buy precisely to own "the world".
Put €10,000 into a fund that tracks this index and €1,522 goes to those three names. About €2,130 goes to seven companies tied to one story, the build-out of artificial intelligence. Both figures come from MSCI factsheets dated 30 September 2026, let's have a look at the arithmetic.
Think of a world ETF as a buffet plate that fills itself. Each dish gets space in proportion to how much everyone else in the room has already taken. If the room piles onto three dishes, so does your plate, and nobody asks whether you wanted them.
So here is a question to keep in mind. If someone asked what you own, would you say "the world"? By the end you can check whether that answer holds for your own fund.
What "the world" means in your fund
The MSCI World index covers large and mid-sized companies in 23 developed countries, about 85% of the free-float market value in each. Market value (market capitalisation) is the share price multiplied by the number of shares. Free float counts only the shares that actually trade, leaving out stakes held by founders, families or governments.
The US is 72.94% of the index. Japan follows at 5.91%, the UK at 3.41%, Canada at 3.29% and France at 2.24%. By sector, information technology alone is 31.78%. Emerging markets such as China and India are left out by design (a broader index adds them, at a cost I come back to below).
The usual answer to "is a world ETF diversified?" is yes, and it is a fair answer. You own over a thousand companies, and no single one can sink you. It is also incomplete, because nearly three-quarters of your money rides on one country's stock market and almost a third on one sector.
There is a euro-specific layer too. You pay in euros, but most of what the fund owns is priced in dollars. So the euro-dollar rate moves your balance even on days when share prices sit still (whether to hedge that is a separate question I will cover in its own piece).
How the plate gets filled
The rule is simple. Each company's weight equals its free-float market value divided by the total of all of them. A toy index with round numbers shows what follows (real factsheets have more decimals and less charm).
Three companies are worth €500, €300 and €200 on day one, so their weights are 50%, 30% and 20%. Then the first company's share price doubles while the other two stay flat. It is now worth €1,000, the total is €1,500, and its weight jumps from 50% to 66.7%.
Nobody at the fund bought more of the winner. The weights moved on their own, like a buffet plate that refills to match the room. A fund that tracks the index holds more of whatever has risen and less of whatever has fallen, without a single decision.
That is the reason index funds are cheap, since there is almost nothing to decide and almost nothing to trade. It is also the reason a rally in a handful of names shows up in your portfolio as concentration.
Have you noticed your fund owning more of the stock everyone talks about? The fund made no decision. Prices made it.
Fun fact: Nvidia's free-float value is $5.25 trillion and the smallest company in the index is worth $2.3 billion, a ratio of about 2,250 to 1. Both sit on the same plate, each served in proportion to its size.
How much of it is one bet on AI?
The factsheet has no "AI" label. It lists sectors and the ten largest holdings, so I built the count from those ten names and I will state the rule so you can change it.
The first group sells the hardware. Nvidia (5.81%) designs the chips that most AI data centres run on, and reported $193.7 billion of data-centre revenue for fiscal 2026, as I covered in who is paying for the AI boom.
Broadcom (1.76%) reported $16.7 billion of AI chip revenue in the quarter to 2 August 2026, up 221% on a year earlier. Micron (1.33%) makes memory chips. Together that is 8.90% of the index.
The second group buys the hardware. Microsoft (4.00%), Alphabet (3.99% across two share classes), Amazon (2.67%) and Meta (1.76%) are four of the five big cloud companies. FactSet expects those five to spend more than $690 billion on equipment in their 2026 fiscal years. Together they are 12.42% of the index.
Add the sellers and the buyers and you get seven companies worth 21.32% of your world fund, or €2,132 of every €10,000. I left out Apple (5.41%) and Tesla (1.12%), whose stories are less about data centres. Count them too and you reach the full top ten, 27.85%.
These seven companies do not move as one stock. They do sell to each other, and their prices lean on the same expectation, namely that the money now going into AI equipment will pay off. In that sense a fifth of a "world" fund is one bet, made by the market on your behalf.
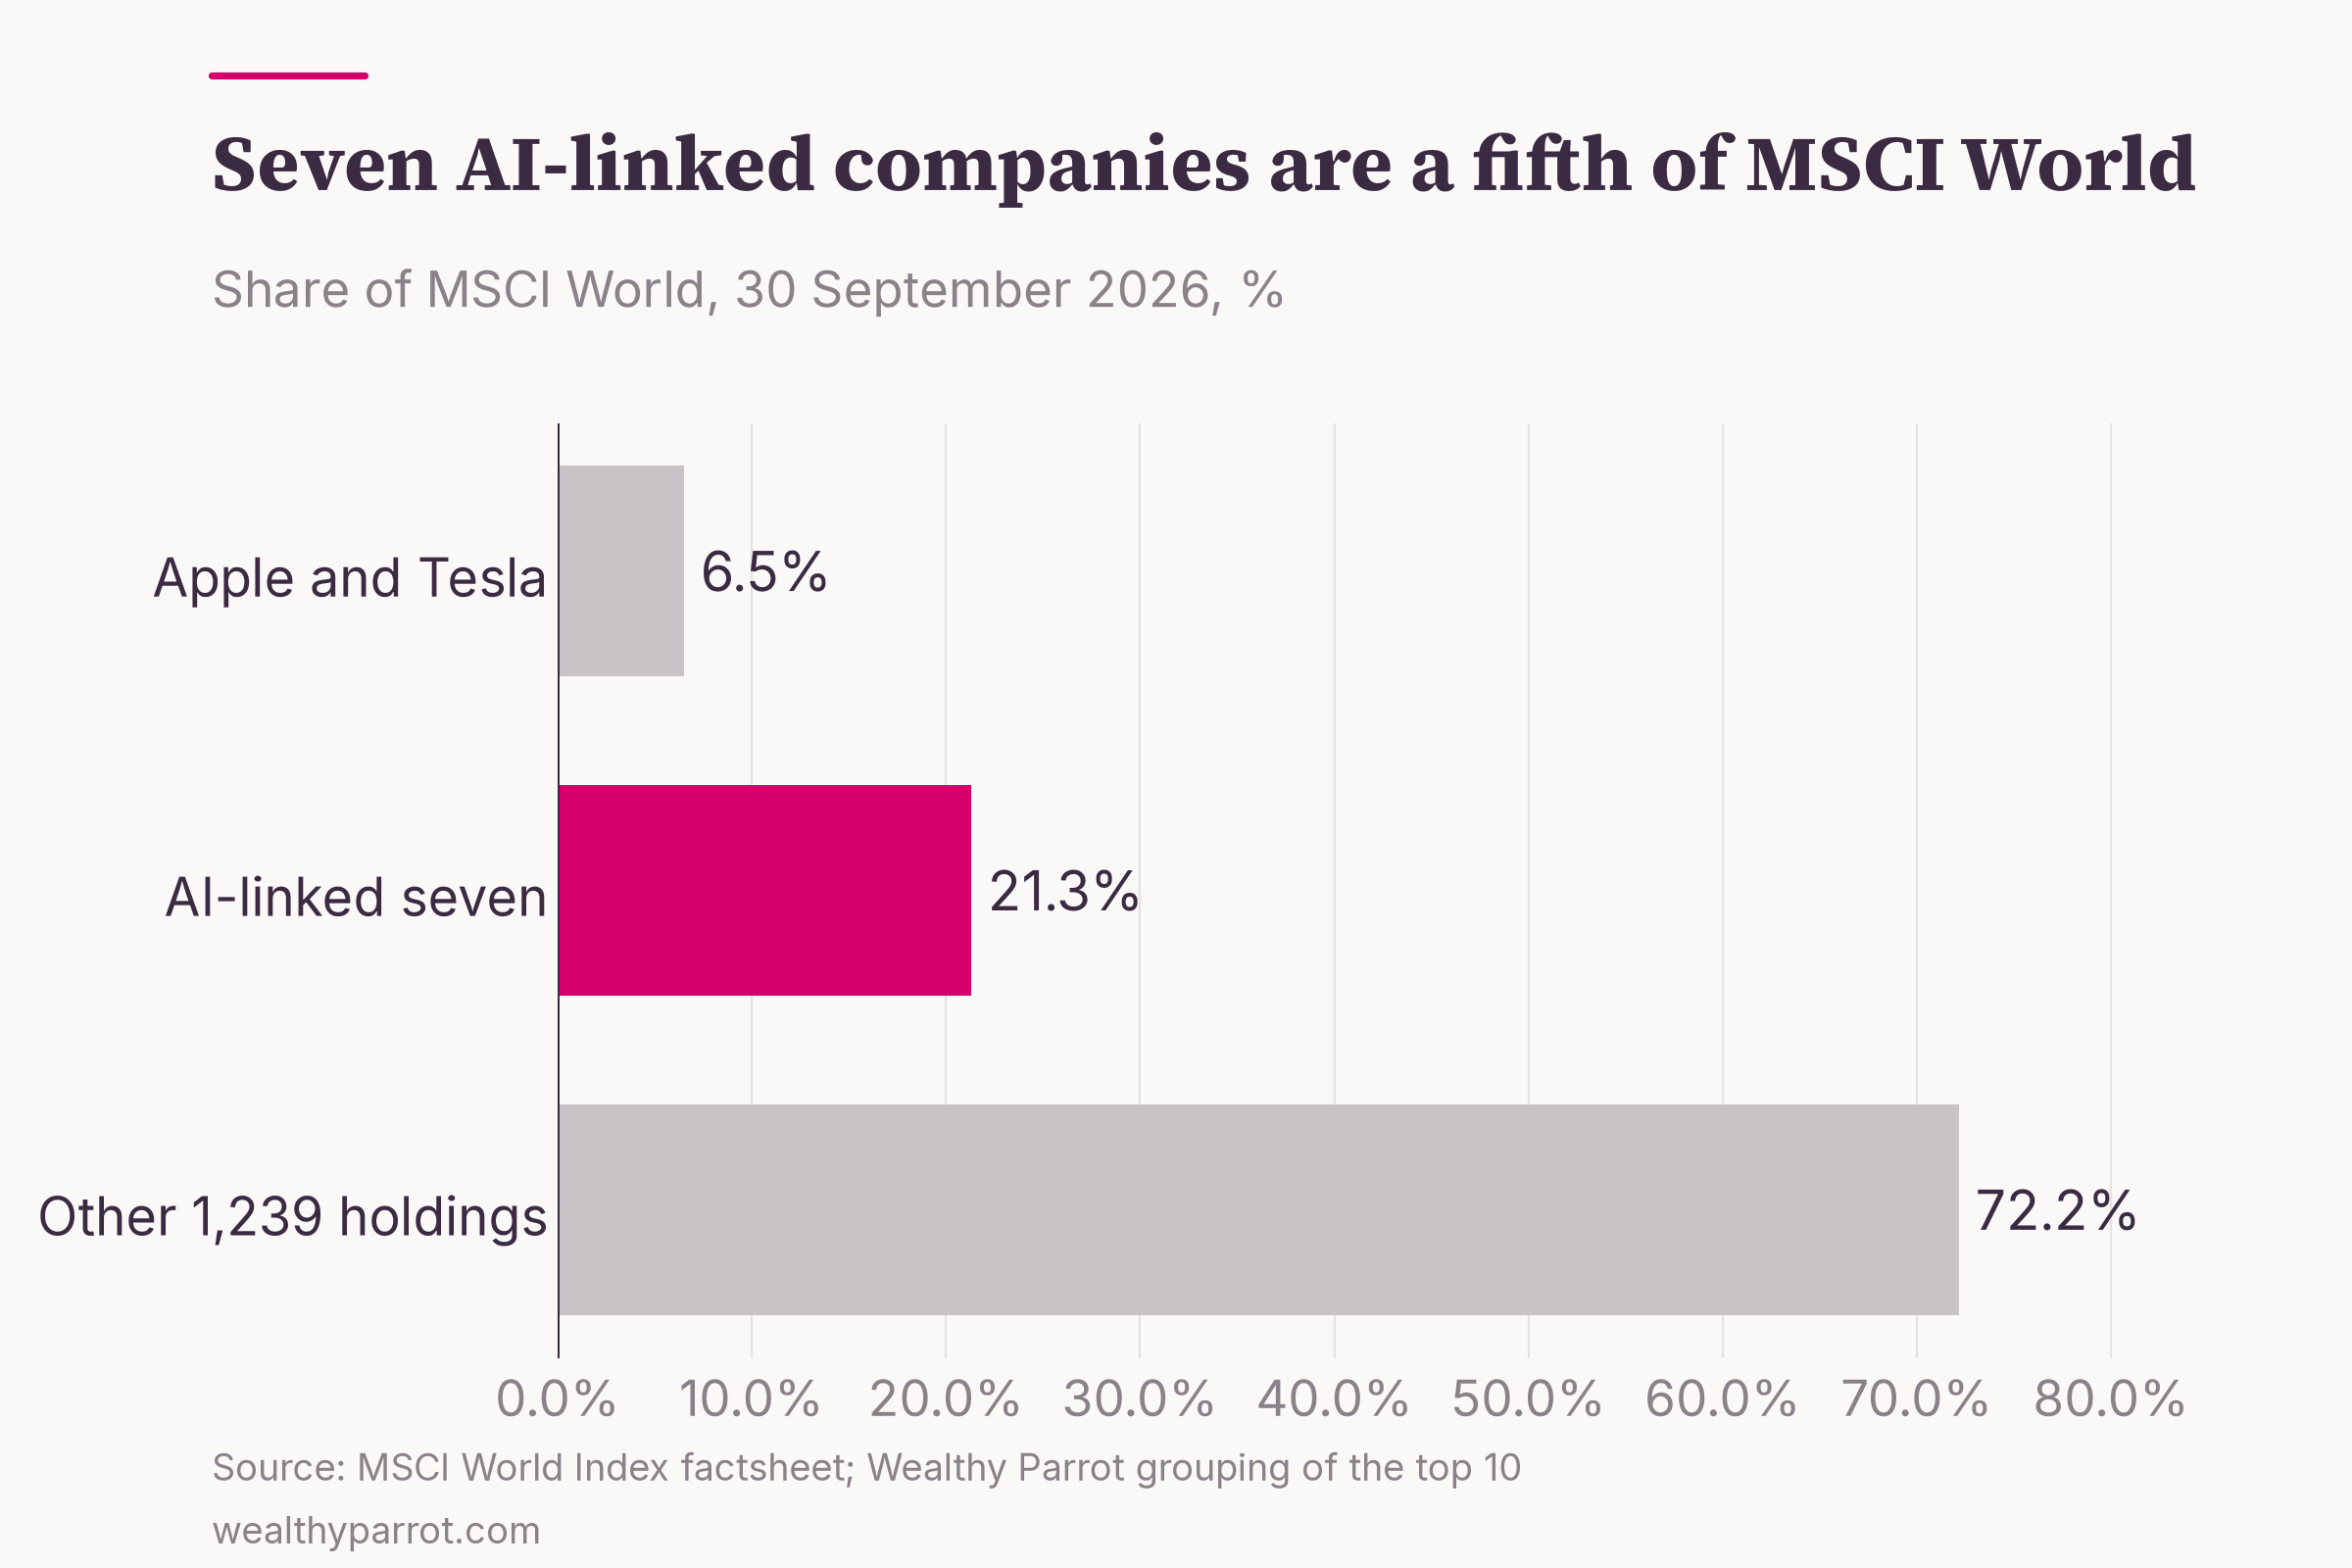
The plate also reshuffles faster than you might think. On MSCI's own index page a month later, on 30 October, Apple had moved back to first place at 5.65% and Micron had dropped out of the top ten. The same counting rule gave 18.39% instead of 21.32%. The names and the totals move every month, and the shape stays the same.
Fun fact: Alphabet appears twice in the top ten, as Class A (2.23%) and Class C (1.76%) shares. The "top ten" is really nine companies, and Alphabet's combined 3.99% puts it fourth, a hair behind Microsoft.
Where Europe went
Here is a test that matters if you live in Europe. Take the 23 countries in the index, add up their economic output, and compare each region's share of output with its share of your fund.
The IMF projects the 23 countries' combined GDP at about $69.1 trillion for 2026. By my sum of the IMF's country figures, the US produces 47.25% of that and developed Europe 36.70%. In the index, the US is 72.94% and Europe, from the MSCI Europe factsheet, is about 15.13%. Europe's share of the plate is well under half of its share of the economy.
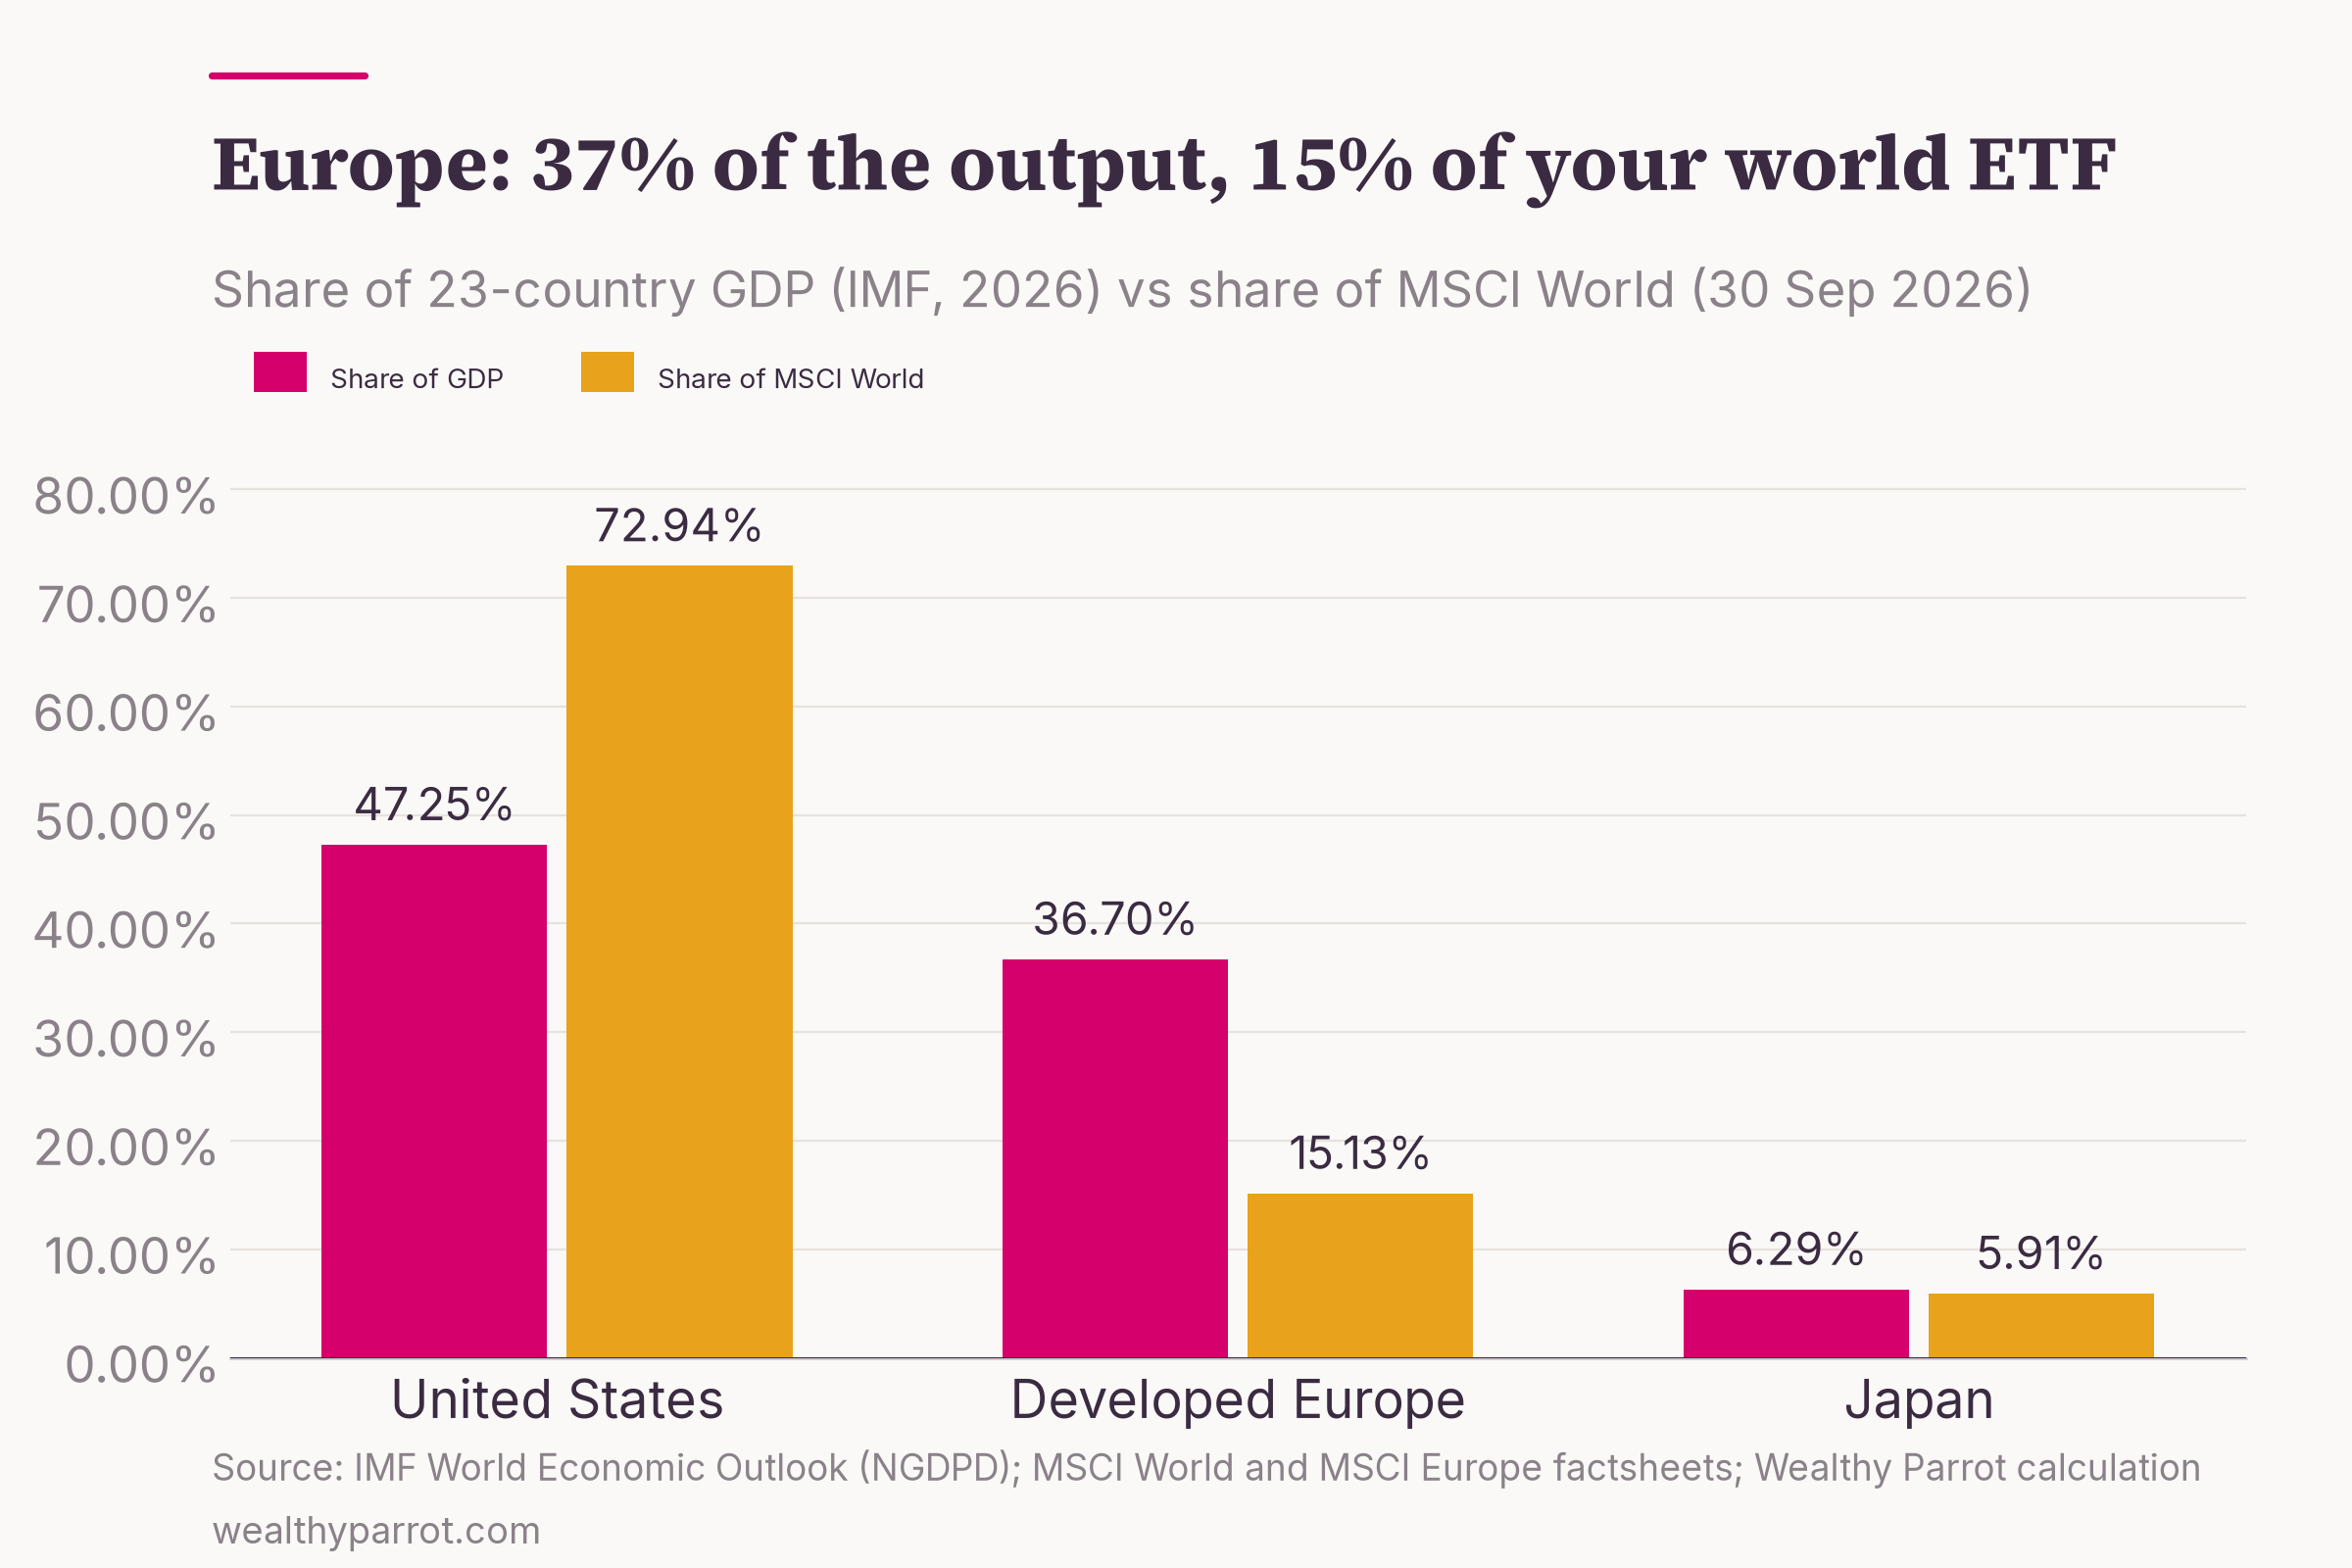
Two caveats keep the comparison honest. Index weights follow where a company is listed and what it is worth, while GDP measures what is produced inside a country. Where a company sells is a third thing again. MSCI's own research found that nearly 64% of its broader all-country index was US-domiciled in June 2026, while the companies' revenue exposure to the US was just below 44%.
So a world fund that is mostly American by passport still earns a good part of its money from customers in Europe and Asia. The gap also reflects the market's judgement that US companies have been more profitable.
Still, the comparison shows what the US weight is. It is a market outcome and not a map of the world economy. If US shares keep outrunning everyone else, the weight keeps rising, and if they lag, it shrinks.
For a European saver this can cut both ways. Your salary, your rent and probably your pension are tied to Europe, so holding a fund that is mostly not European spreads your risk beyond your own economy (that part is a feature). The surprise is only if you thought your "world" fund already gave Europe its economic weight.
Fun fact: ASML, the Dutch company that makes the machines behind every advanced AI chip, is Europe's largest listed company at a float value of $704 billion. In MSCI World that is 0.78% of the index, less than Tesla's 1.12%.
Who decides what goes on the buffet
If weights follow market value, you might think nobody is in charge. Someone still decides which dishes are allowed on the buffet at all, and when new ones arrive.
That someone is an index provider. Three firms, MSCI, S&P Dow Jones Indices and FTSE Russell, publish the benchmarks most index funds copy. Researchers who studied them describe index providers as private authorities. Their brand, and the habit of funds following their lists, gives their rules much of the force of regulation, even though they are companies selling a product.
This year offered a live case. On 30 April, Bloomberg reported that S&P was considering rules to fast-track very large new listings into the S&P 500. The proposal would have cut the required waiting period after a stock market debut from 12 months to six, and added exceptions for the biggest firms.
On 4 June S&P published the outcome and kept its rules as they were. Its release said exceptions to its financial-viability, waiting-period and float requirements "should not be granted solely based on market capitalization". It added that the committee making the call is "not bound by any comments" it receives.
You may like that decision or not. Either way, a committee chose when billions of index dollars would reach some of the largest companies ever to list, and every fund copying that index will follow its choice.
MSCI runs to a calendar it publishes in advance. Its next review is announced on 11 November and takes effect on 1 December. If your fund tracks an MSCI index, some companies are about to be added, dropped or resized, on a date you did not pick.
The price of getting in
An addition to a big index is announced before it happens, and everyone knows the funds tracking it will have to buy. Traders who can move quickly buy first and sell to the funds later, a practice called front-running.
A guide written for the Bogleheads, a community of index investors (named after Vanguard founder John Bogle), cites a study by the fund manager Winton Capital. It found that from 1990 to 2011 the S&P 500 lost about 0.2 percentage points a year to this effect. I could not locate the original study, so treat that figure as reported at one remove.
Fun fact: The guide's example is American Airlines, which rose 11% in the four days before it joined the S&P 500. The airline did not get better that week. It was about to be bought by every fund that copies the index.
A European study puts numbers on the longer run. Researchers looked at stocks added to Germany's DAX 40 between 2010 and 2023, and found that they beat the index by an average of 33.2% in the 12 months before inclusion. Over the following 24 months they trailed it by an average of 36.1%. In the DAX, the index tended to add a stock after most of its rise had already happened.
That is a 40-stock German index, not a 1,249-stock world fund, and I did not find a matching study for MSCI World. The effect may well be smaller when each addition is a thin slice of a huge index. The study still shows that a "passive" fund carries active decisions, and that someone pays for them.
Who gains from an addition is clear enough. Whoever owned the stock before the announcement gains when the funds have to buy. The index providers, which the researchers above describe as highly profitable, gain authority with every fund that follows their list. The fund holder buys at the higher price and carries whatever comes next (yes, really, even in a fund that "does nothing").
Does concentration actually hurt you?
The general rule of thumb is that a healthy level of diversification decreases portfolio risk, meaning your portfolio will grow less in a bull market, but it will also fall less in a bear market. Research goes a bit deeper.
One line of work asks what index money does to prices. Two economists at Harvard and Chicago Booth estimated that every $1 moved into the stock market raises its total value by about $5, because most funds follow fixed mandates (a set share in shares, say) and barely respond to prices.
A 2025 paper in the Review of Financial Studies argues that this extra push lands hardest on the largest firms. It finds that the biggest S&P 500 companies rise most after money flows into that index.
If both hold, the plate does not just mirror the room. It also nudges the room toward the dishes already piled highest.
The other side of the argument is strong too. A study of every US stock since 1926 found that most of them did worse over their lifetime than one-month Treasury bills (short-term US government debt). The best-performing 1,092 companies, slightly more than 4% of the total, accounted for all of the stock market's net wealth creation.
Seen that way, a few giants carrying the index is how stock markets have always paid out. A cap-weighted fund holds every candidate and lets the winners grow into the biggest slices, so you own them whoever they turn out to be. A hand-picked fund can miss them, and an equal-weight one keeps trimming them.
A third line looks at who owns whom. Vanguard, State Street and BlackRock hold more than 20% of the shares of S&P 500 companies, up from 5% in 1998, according to a Harvard and Boston University study cited in Robin Wigglesworth's Trillions. Three fund firms owning more than a fifth of corporate America raises questions that reach beyond your own returns.
History offers a warning without a forecast. In my piece on investing at all-time highs I described the Nifty Fifty of the early 1970s. These were excellent companies bid up to price-to-earnings ratios (the share price divided by a year's profit per share) of 80 to 90, which later fell to 8 or 9. Great businesses can be poor purchases at the wrong price, and nobody can tell you whether today's top ten are at that price.
The fair conclusion is narrower than the headlines. Concentration changes what you own and how one story can move your whole portfolio. Whether it costs you money over the long run is still an open question depending on other factors such as asset type, when you start to invest and how long you hold your assets for.
What you can do about it
There are four reasonable responses, and each one has a price.
The first is to keep the plate as served. A market-value index is the combined holding of everyone who invests, and a low-cost fund that matches it is a sensible default. The only condition is knowing what is on the plate before a bad year arrives. If the seven AI-linked names fell by a third, a fund holding 21.32% of them would lose about 7% from that alone, which feels very different from "1,249 companies".
The second is to widen the buffet. Imagine adding more dishes to the table. The big ones are still there, but each takes up less of the plate.
Funds that add emerging markets, or small and mid-sized companies, dilute the top ten because the total grows. You take on different risks in exchange (smaller companies and emerging markets have plenty of their own), and the US and AI weights fall without disappearing.
The third is to change the rule that fills the plate. Equal-weight indexes give every company the same slice, and some indexes weight countries by economic output instead of market value. Both cut the top-heavy tilt, and both are bets of their own.
They also trade far more. MSCI's equal-weighted version of the world index turned over 32.08% of its holdings in the past 12 months, against 3.18% for the standard index, because it has to sell winners and buy laggards at every rebalance (the same mechanism I unpacked in Shannon's Demon).
Equal weighting bets on smaller companies doing well, and output weighting bets that the gap between market value and GDP will narrow. Expect higher fees and more trading, and read each fund's factsheet rather than its name.
The fourth is to look at your whole financial life, not just the fund. If you work in tech, your salary, any shares or options from your employer and your world ETF may all depend on the same handful of companies. If you work in a European industry, a fund that leans away from Europe may already balance your job risk. The question to ask is how many of your eggs, across everything, sit in the same basket.
None of these is a recommendation. They are the choices on the table, and the right one depends on what else you own and how long you will hold.
Practical takeaways
- Download the factsheet of the index your fund tracks (the index, not the fund's marketing page) and add up the top ten weights.
- Write down three numbers: the top-ten total, the US weight and the information technology weight.
- Turn them into euros for your own holding. On €10,000 in MSCI World at the 30 September weights that is €2,785 in ten stocks, €7,294 in the US and €3,178 in technology.
- Count the AI-linked names yourself, using your own rule, and decide whether that share is a bet you are comfortable making.
- Check the rest of your money. A tech salary, employer shares and a world ETF can all be one exposure, while a European job may already offset some of it.
- If your fund tracks MSCI, read the list of additions and deletions when the next review is announced on 11 November (it takes effect on 1 December).
Back to the plate
Your world ETF has been filling its plate by the same rule since the day you bought it, and that rule has served index investors well for decades. What changed is how much of the plate a few dishes now take.
Before the next wobble in chip stocks, open the factsheet and write the top-ten total, the US weight and the Europe weight next to your net worth. If those three numbers match what you meant to own, carry on. If they don't, the four options above are where to start.