Income statement: real examples


To put in practice the theory on how an income statement is structured (in the article HERE), let's take a look at a couple income statements. I don't want to make you certified accountants therefore we'll just focus on the main peculiarities of the income statements. You can find all the original financial statements on the company website, normally under the investor relations section. For simplicity on this page I have reported the income statements only. For simplicity, I will use the same companies that I used in the balance sheet examples and cash flow statement examples, as I believe it will make it easier to connect the dots.
General note
- Different companies can have different fiscal years. For example Disney uses Sep-Oct, while many other companies use Jan-Dec. This normally depends on the seasonality/business cycle of each company but it's entirely up to the Company.
- Always read the units used. Big companies (like the examples on this page) use millions, but again it's up to the company. For example Netflix, at the time of writing, used thousands.
- Since there are no strict requirements on the structure, companies show different level of details, hence you will often find different granularities. After you read a few, you'll start understanding the content even though it might be grouped or look slightly different.
Disney
Walt Disney Company has been around for 100 years, pioneering the American animation history. But it's not only about animation anymore, as it has become an entertainment empire, with amusement parks that attract millions of visitors every year, themed resorts, TV channels, toy stores and much more. Let's dig into the income statement:
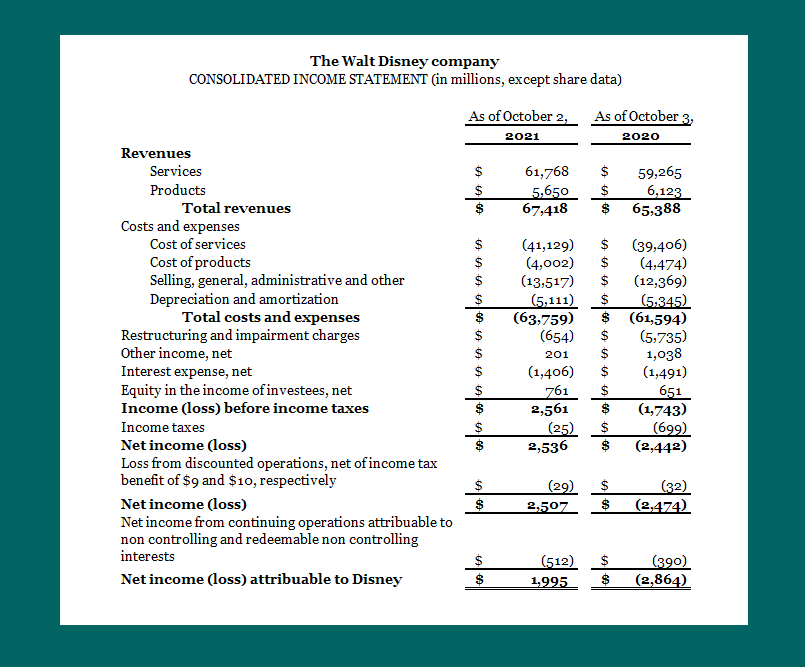
If you look at the (consolidated) income statement above, you'll see that Disney splits revenue into Services and Products, however if you want to dig deeper and look the segments, you'll have to read the whole annual report.
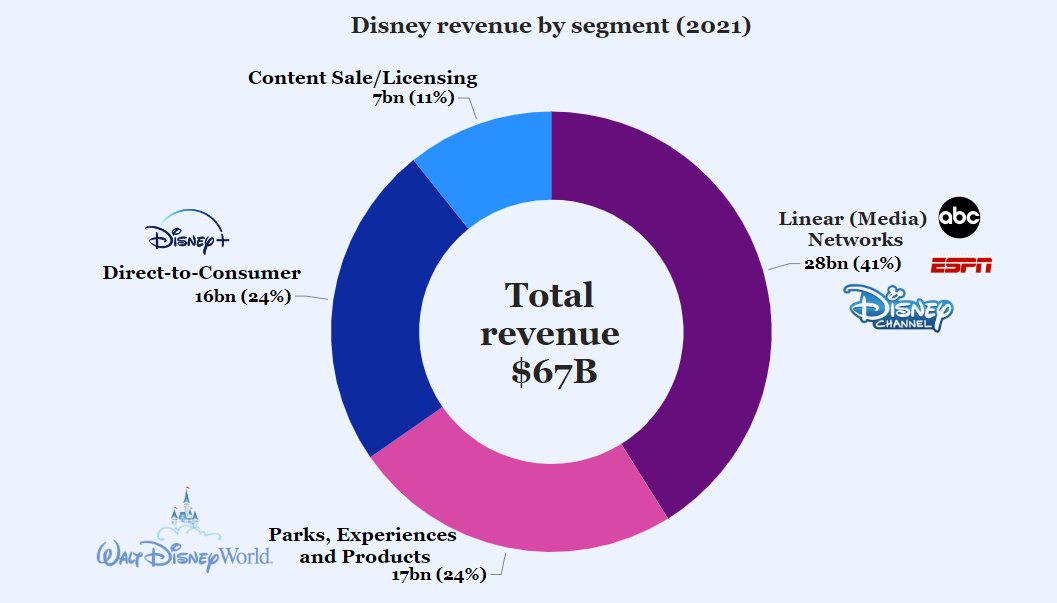
Disney has two segments:
- Disney Media and Entertainment Distribution (DMED): it includes its movies, television network, streaming services production and distribution activities. This means things like ESPN, Fox, Disney+, but also Blu-ray discs, theatrical distribution, music distribution, stage plays and post-production services. DMED's revenue in 2021 were $51B.
- Disney Parks, Experiences, and Products (DPEP): it includes Disney's parks, cruise line, resorts, consumer products and publishing divisions. DPEP's revenue in 2021 were $17B.
If we cut the revenues one level deeper, we get:
Let's analyze how Disney spends money:
- Being a media-heavy business, other than the usual things, most of the money goes to programming and production costs (incl. sports rights), technical support costs and distribution costs.
- For the DPEP segment, the costs are mainly related to maintaining or expanding the infrastructures of Parks and Resorts; this include repairs and maintenance, property taxes, utilities and fuel, etc. Depreciation and amortization is also significant due to the capital investments required.
- Restructuring and Impairment Charges refer to asset impairments and severance costs related to the shut-down of animation studios or retail stores. In 2020 it was particularly high due to the severance costs and contract termination charges in connection with the acquisition and integration of 21st century fox and severance in connection with the reduction-in-force at the Parks and Experiences (due to Covid-19).
You can find the official financial statements for Disney on their website.
Amazon
When Amazon was founded in July 1994 it was selling only books. 30 years forward and it's not only an e-commerce giant, but one of the most used cloud computing provider, has physical stores where there is no cashier, and a division of consumer electronics (among other things); this was achieved by a mix of organic growth and a lot of acquisitions. We can expect an interesting income statement:
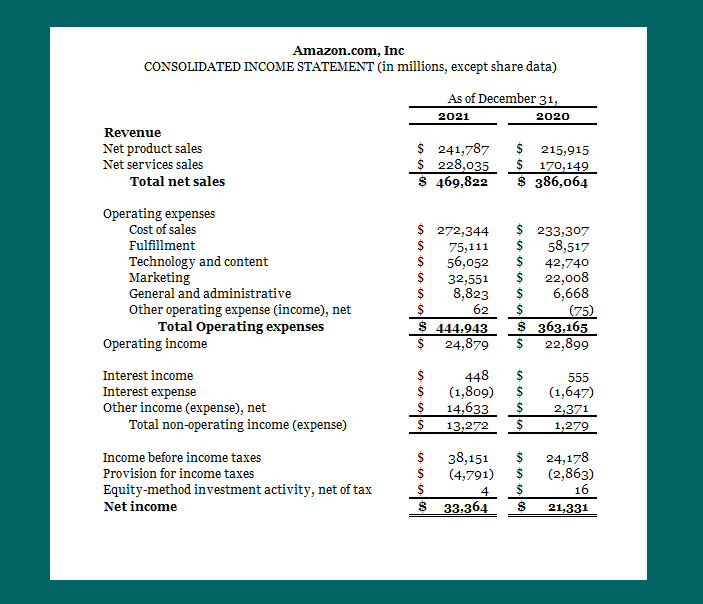
Amazon makes a lot of money, and seems like its growth is not even close to be over. As said for Disney, the consolidated statement aggregates some figures to make it easier to read, hence the revenue are not split by segment. However, you can find that info in the annual report:
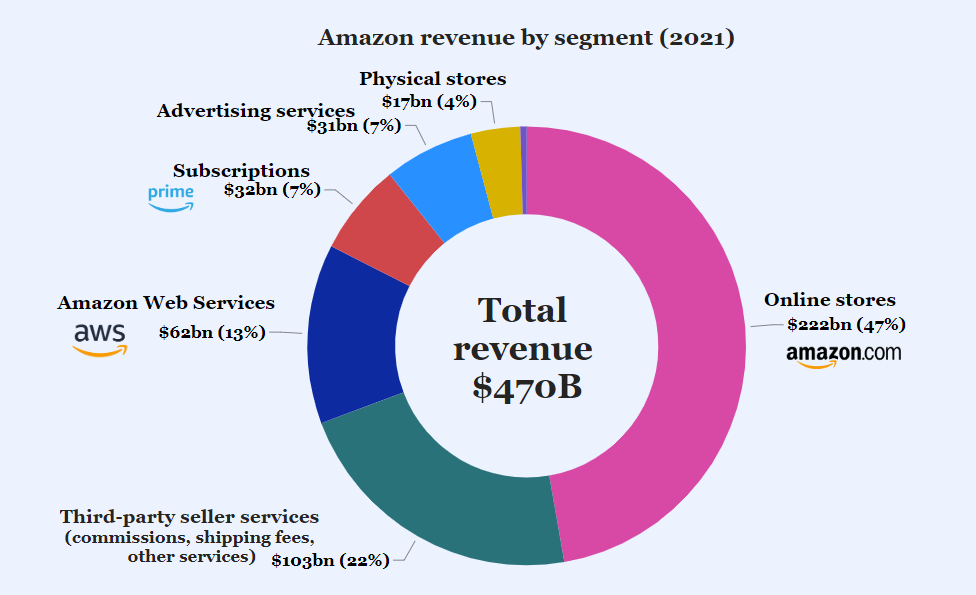
When it come to Amazon's main costs we find:
- Cost of Sales: this is by far the biggest cost with almost 62% of the full operating expenses. It includes many things such as the purchase of consumer products, logistics and shipping costs, and digital media content costs (video and music).
- Fulfillment: Amazon has BIG warehouses and it's not cheap to run them; physical stores and customer service centers costs are here too. In fulfillment we find all the costs related to inbound and outbound logistics. This means things like buying, receiving, inspecting, and warehousing inventories plus picking, packaging, and preparing customer orders for shipment (and payment processing and related transaction costs).
- Technology and content costs: are also substantial. This is basically the R&D costs of new and existing products and services such as development, design, and maintenance of the stores, curation and display of products and services made available in our online stores, and infrastructure costs (mainly IT, rent, utilities).
You can find the official financial statements for Amazon on their website.
HSBC
The annual report (where you find the financial statements), is probably the biggest I've ever seen with a mind-boggling 410 pages! It does cover way more than numbers, as it looks more like a dossier/sales pitch of the company: past, present and future plans, including multiple insights and perspectives on the industries and geographies where HSBC operates. This could be justified by the fact that they are a multinational bank, in fact one of the biggest of the world, and they use the annual report as a way to reassure its customers and investors that their money is safe. If you look at the income statement below, you'll notice it looks very different from the previous ones:
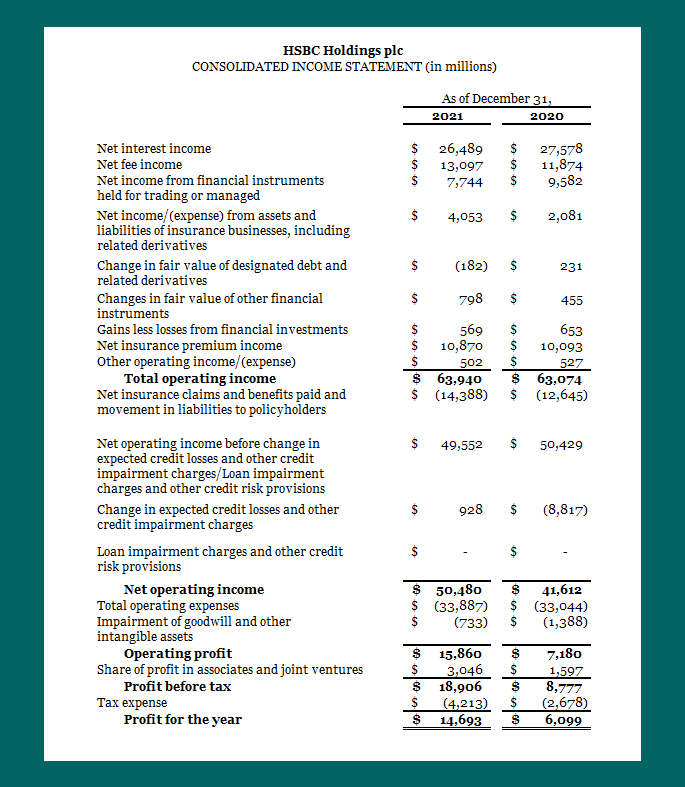
In terms of segments, HSBC has 3 segments:
- Wealth and Personal Banking, 43% of revenue
- Commercial Banking, 27% of revenue
- Global Banking and Markets, 30% of revenue
If we look at the top 3 revenue sources we find:
- Net interest income: that measures the difference between the revenue generated from HSBC's interest-bearing assets (e.g. mortgages and commercial loans) and the expenses associated with paying on its interest-bearing liabilities (customer deposits).
- Net fee income: these are all the fees charged to HSBC's customers for things like overdraft charges, late fees, wire transfer fees, etc.
- Net insurance premium income: as the name suggests, it's the revenue from HSBC's insurance policies bought by costumers.
If you look at the income statements for 2021 vs 2020, you'll notice improvements in the former vs the latter, thanks to improvements in global economic conditions, which resulted in releases of expected credit loss allowances and the impact of lower interest rates. A very visible example is the Changes in expected credit losses and other credit impairment charges (‘ECL’) where there is a $8bn difference Year-over-Year.
You can find the official financial statements for HSBC on their website.